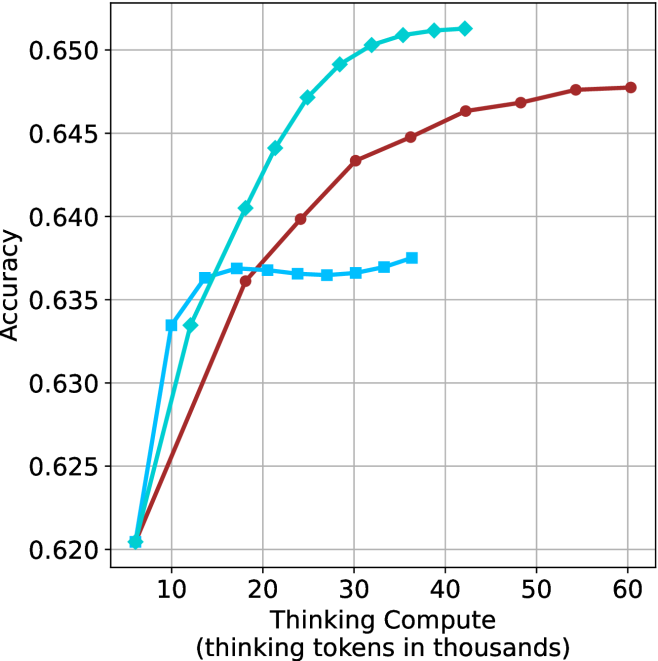
## Line Graph: Accuracy vs. Thinking Compute (Tokens in Thousands)
### Overview
The image depicts a line graph comparing the accuracy of three computational models (Model A, Model B, Model C) across varying levels of "Thinking Compute" (measured in thousands of thinking tokens). The x-axis represents compute scale (10–60k tokens), and the y-axis represents accuracy (0.620–0.650). Three distinct trends are observed, with Model C achieving the highest accuracy but plateauing earlier than others.
### Components/Axes
- **X-axis**: "Thinking Compute (thinking tokens in thousands)"
- Scale: 10 → 60 (increments of 10)
- **Y-axis**: "Accuracy"
- Scale: 0.620 → 0.650 (increments of 0.005)
- **Legend**: Top-right corner
- Blue: Model A
- Red: Model B
- Green: Model C
### Detailed Analysis
1. **Model A (Blue Line)**
- Starts at 0.620 accuracy at 10k tokens.
- Sharp rise to 0.635 at 20k tokens.
- Plateaus between 20k–30k tokens (~0.635–0.637).
- Slight increase to 0.637 at 40k tokens.
2. **Model B (Red Line)**
- Gradual ascent from 0.620 at 10k tokens.
- Reaches 0.648 at 60k tokens.
- Consistent upward slope with no plateau.
3. **Model C (Green Line)**
- Steep rise from 0.620 at 10k tokens.
- Peaks at 0.650 at 40k tokens.
- Plateaus at 0.650 from 40k–60k tokens.
### Key Observations
- **Model C** achieves the highest accuracy (0.650) but plateaus earlier than others.
- **Model B** shows the most sustained improvement, reaching 0.648 at maximum compute.
- **Model A** exhibits diminishing returns after 20k tokens, with minimal gains beyond that point.
- All models start at identical accuracy (0.620) at 10k tokens.
### Interpretation
The data suggests a strong correlation between compute scale and accuracy, but with diminishing returns at higher compute levels. **Model C** is the most efficient, achieving peak accuracy (0.650) at 40k tokens, while **Model B** demonstrates the most scalable performance, continuing to improve up to 60k tokens. **Model A**’s plateau indicates potential inefficiencies or architectural limitations at higher compute levels. The graph highlights trade-offs between compute investment and accuracy gains, with Model C offering the best balance of efficiency and performance for the given range.