## Line Chart: Average CPU Usage During zk Generation Stages
### Overview
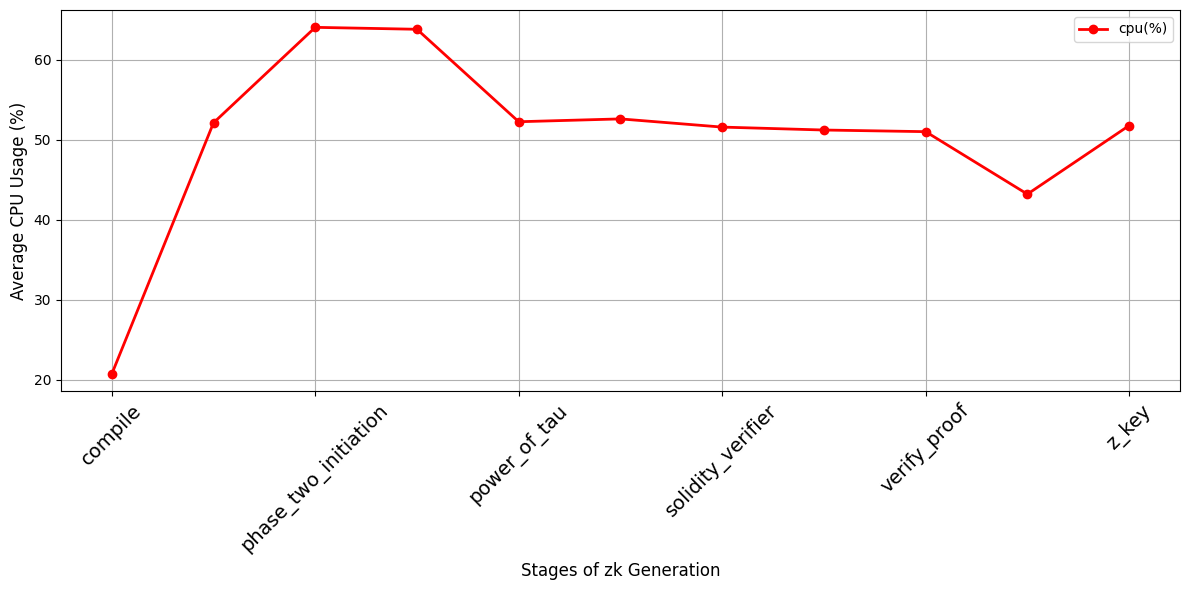
The image is a line chart showing the average CPU usage (%) at different stages of zk (zero-knowledge) generation. The x-axis represents the stages of zk generation, and the y-axis represents the average CPU usage in percentage. The chart displays a single data series representing CPU usage across these stages.
### Components/Axes
* **X-axis:** Stages of zk Generation. The stages are: compile, phase\_two\_initiation, power\_of\_tau, solidity\_verifier, verify\_proof, and z\_key.
* **Y-axis:** Average CPU Usage (%). The scale ranges from 20% to 60%.
* **Legend:** Located in the top-right corner, indicating that the red line represents "cpu(%)".
* **Grid:** The chart has a grid for easier reading of values.
### Detailed Analysis
The red line represents the CPU usage at each stage.
* **compile:** CPU usage starts at approximately 21%.
* **phase\_two\_initiation:** CPU usage increases sharply to approximately 64%.
* **power\_of\_tau:** CPU usage decreases to approximately 52%.
* **solidity\_verifier:** CPU usage remains relatively stable at approximately 52%.
* **verify\_proof:** CPU usage decreases to approximately 51%.
* **z\_key:** CPU usage increases to approximately 52%.
### Key Observations
* The "phase\_two\_initiation" stage has the highest CPU usage.
* CPU usage is lowest during the "compile" stage.
* There is a significant increase in CPU usage from "compile" to "phase\_two\_initiation".
* CPU usage remains relatively stable between "power\_of\_tau" and "solidity\_verifier".
* CPU usage decreases at "verify_proof" and then increases slightly at "z_key".
### Interpretation
The chart illustrates the computational demands of different stages in zk generation. The "phase\_two\_initiation" stage appears to be the most CPU-intensive, suggesting it involves complex calculations or processes. The relatively low CPU usage during the "compile" stage indicates that this initial step is less demanding. The fluctuations in CPU usage across the other stages likely reflect the varying computational requirements of each process. The data suggests that optimizing the "phase\_two\_initiation" stage could lead to significant improvements in overall zk generation efficiency.