\n
## Line Chart: Average CPU Usage During zk Generation Stages
### Overview
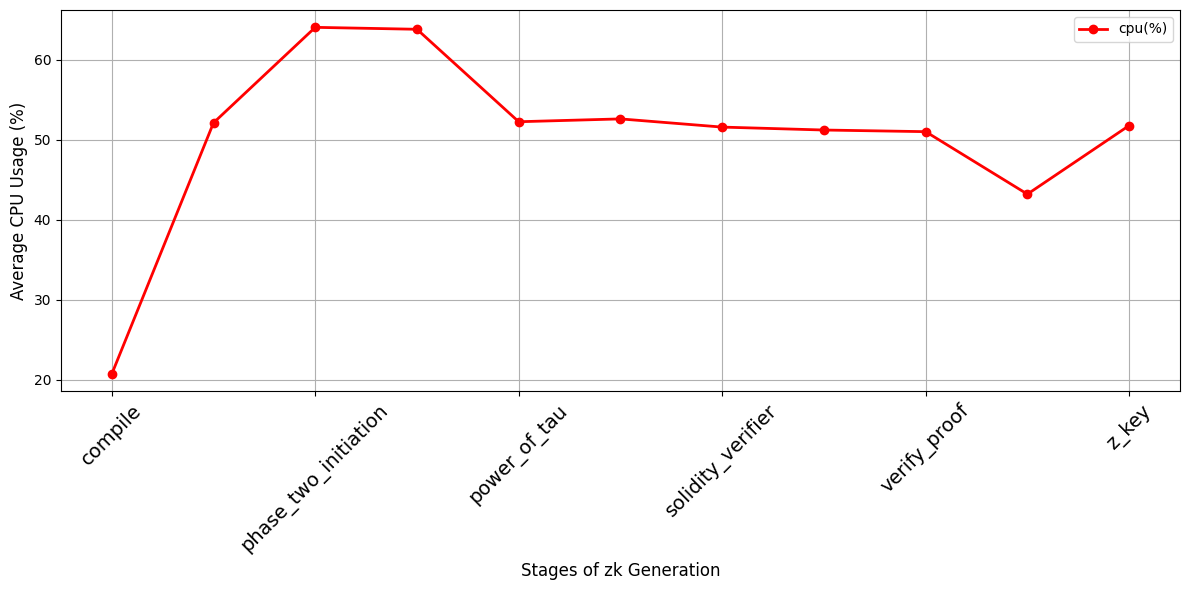
This image presents a line chart illustrating the average CPU usage (%) across different stages of zk (Zero-Knowledge) generation. The x-axis represents the stages, and the y-axis represents the average CPU usage as a percentage. A single data series, labeled "cpu (%)", is plotted as a red line.
### Components/Axes
* **X-axis Title:** Stages of zk Generation
* **Y-axis Title:** Average CPU Usage (%)
* **X-axis Labels (Stages):** compile, phase\_two\_initiation, power\_of\_tau, solidity\_verifier, verify\_proof, z\_key
* **Y-axis Scale:** Ranges from approximately 20% to 65%. The scale is linear with increments of 10%.
* **Legend:** Located in the top-right corner.
* Label: cpu (%)
* Color: Red
### Detailed Analysis
The line representing CPU usage exhibits significant fluctuations across the different stages.
* **compile:** Starts at approximately 22%.
* **phase\_two\_initiation:** Increases sharply to a peak of approximately 64%.
* **power\_of\_tau:** Decreases to approximately 52%.
* **solidity\_verifier:** Decreases slightly to approximately 50%.
* **verify\_proof:** Decreases to approximately 48%.
* **z\_key:** Increases to approximately 44%.
Specifically:
| Stage | Approximate CPU Usage (%) |
| --------------------- | ------------------------- |
| compile | 22 |
| phase\_two\_initiation | 64 |
| power\_of\_tau | 52 |
| solidity\_verifier | 50 |
| verify\_proof | 48 |
| z\_key | 44 |
The line generally slopes downward from "phase\_two\_initiation" to "verify\_proof", then slightly increases at "z\_key".
### Key Observations
* The "phase\_two\_initiation" stage consumes the most CPU resources, peaking at approximately 64%.
* The "compile" stage has the lowest CPU usage, at approximately 22%.
* CPU usage remains relatively stable between "power\_of\_tau", "solidity\_verifier", and "verify\_proof" stages, hovering around 50%.
* There is a noticeable drop in CPU usage from "phase\_two\_initiation" to "power\_of\_tau".
### Interpretation
The chart demonstrates the varying computational demands of different stages within the zk generation process. The high CPU usage during "phase\_two\_initiation" suggests this stage is the most resource-intensive, potentially involving complex calculations or data processing. The relatively lower and stable CPU usage during "power\_of\_tau", "solidity\_verifier", and "verify\_proof" indicates these stages are less computationally demanding. The slight increase in CPU usage during "z\_key" might be due to finalization or output operations.
This information is valuable for optimizing the zk generation process. Identifying the most resource-intensive stages allows for targeted optimization efforts, such as parallelization or algorithm improvements, to reduce overall processing time and resource consumption. The data suggests that focusing on optimizing "phase\_two\_initiation" would yield the most significant performance gains.