## Line Chart: Average CPU Usage Across Stages of zk Generation
### Overview
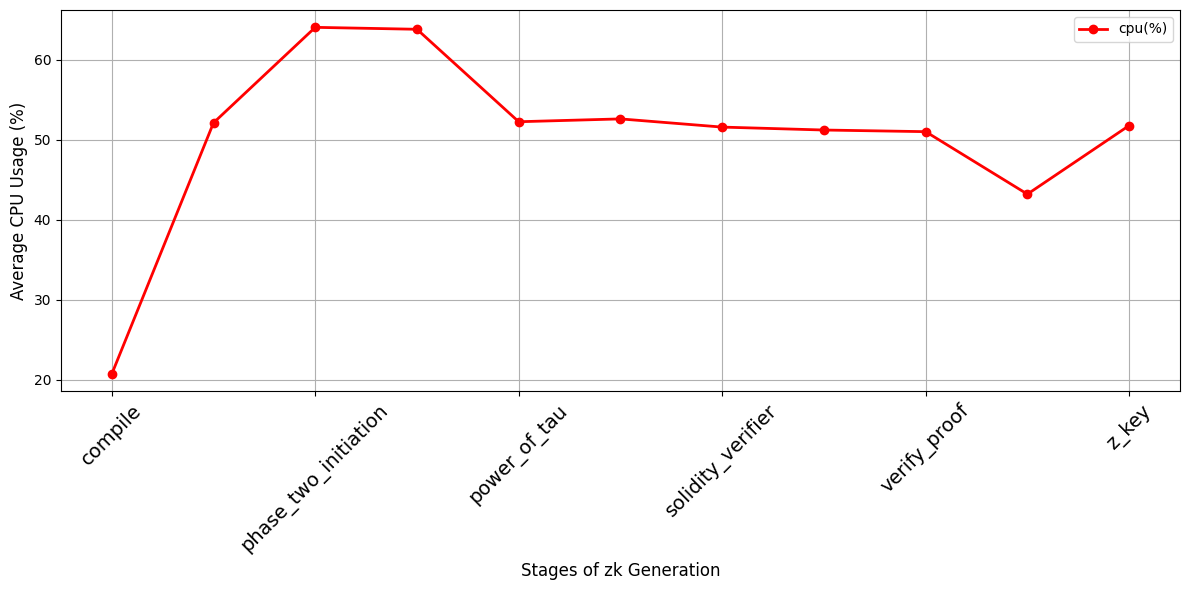
The image displays a line chart illustrating the average CPU usage percentage across six distinct stages of a "zk Generation" process. The chart shows a significant spike in CPU usage early in the process, followed by a general plateau with a notable dip before the final stage.
### Components/Axes
* **Chart Type:** Line chart with data points marked by red circles.
* **Y-Axis (Vertical):**
* **Label:** "Average CPU Usage (%)"
* **Scale:** Linear scale ranging from 20 to 60, with major gridlines at intervals of 10 (20, 30, 40, 50, 60).
* **X-Axis (Horizontal):**
* **Label:** "Stages of zk Generation"
* **Categories (from left to right):** `compile`, `phase_two_initiation`, `power_of_tau`, `solidity_verifier`, `verify_proof`, `z_key`. The labels are rotated approximately 45 degrees for readability.
* **Legend:**
* **Position:** Top-right corner of the chart area.
* **Content:** A red line with a circular marker labeled "cpu(%)".
* **Data Series:** A single data series represented by a solid red line connecting circular red markers.
### Detailed Analysis
The following table lists the approximate CPU usage for each labeled stage on the x-axis. Values are estimated based on the position of the data points relative to the y-axis gridlines.
| Stage (X-Axis Label) | Approximate Average CPU Usage (%) | Visual Trend Description |
| :--- | :--- | :--- |
| `compile` | ~21% | Starting point, lowest value on the chart. |
| `phase_two_initiation` | ~64% | Sharp, steep increase from the previous stage. This is the peak value on the chart. |
| `power_of_tau` | ~52% | Significant decrease from the peak. |
| `solidity_verifier` | ~52.5% | Very slight increase, nearly level with the previous stage. |
| `verify_proof` | ~51% | Slight decrease. |
| *(Unlabeled point between `verify_proof` and `z_key`)* | ~43% | A distinct dip, representing the second-lowest point after the initial `compile` stage. |
| `z_key` | ~51.5% | Recovery from the dip, returning to a level similar to `solidity_verifier` and `verify_proof`. |
**Trend Verification:** The line exhibits a sharp upward slope from `compile` to `phase_two_initiation`, followed by a downward slope to `power_of_tau`. From `power_of_tau` to `verify_proof`, the line is relatively flat with minor fluctuations. It then dips sharply before rising again to the final point at `z_key`.
### Key Observations
1. **Peak Resource Demand:** The `phase_two_initiation` stage is the most computationally intensive, consuming approximately 64% average CPU usage, which is over three times the usage of the initial `compile` stage.
2. **Plateau Phase:** After the initial spike and drop, CPU usage stabilizes in the 51-53% range for the middle stages (`power_of_tau`, `solidity_verifier`, `verify_proof`).
3. **Notable Dip:** There is an unexplained, significant drop in CPU usage to approximately 43% at a point between the `verify_proof` and `z_key` stages. This point is not labeled on the x-axis.
4. **Final Stage Recovery:** The process concludes with the `z_key` stage, where CPU usage recovers to the plateau level of around 51.5%.
### Interpretation
This chart profiles the computational load of a zero-knowledge (zk) proof generation workflow. The data suggests that the process is not uniformly demanding.
* **Workflow Bottleneck:** The `phase_two_initiation` stage is clearly the primary computational bottleneck. Resources should be focused here for optimization, as improvements here would have the greatest impact on overall process time.
* **Process Phases:** The workflow can be interpreted as having three phases: 1) A low-overhead setup (`compile`), 2) A highly intensive core computation (`phase_two_initiation`), and 3) A series of subsequent verification and key generation steps (`power_of_tau` through `z_key`) that have a moderate, relatively consistent CPU demand.
* **The Unlabeled Dip:** The sharp, unlabeled dip is an anomaly. It could represent a brief I/O-bound operation, a pause for data transfer, or a stage that is highly parallelized and thus shows lower *average* CPU usage per core. Its position suggests it occurs after proof verification but before final key generation.
* **Resource Planning:** For system provisioning, the peak usage (~64%) dictates the minimum CPU capacity required to avoid throttling during the most demanding phase. The average usage across the entire process, however, would be lower, closer to the 50-52% plateau.
**Language Note:** All text in the image is in English.