## Line Chart: Stages of zk Generation
### Overview
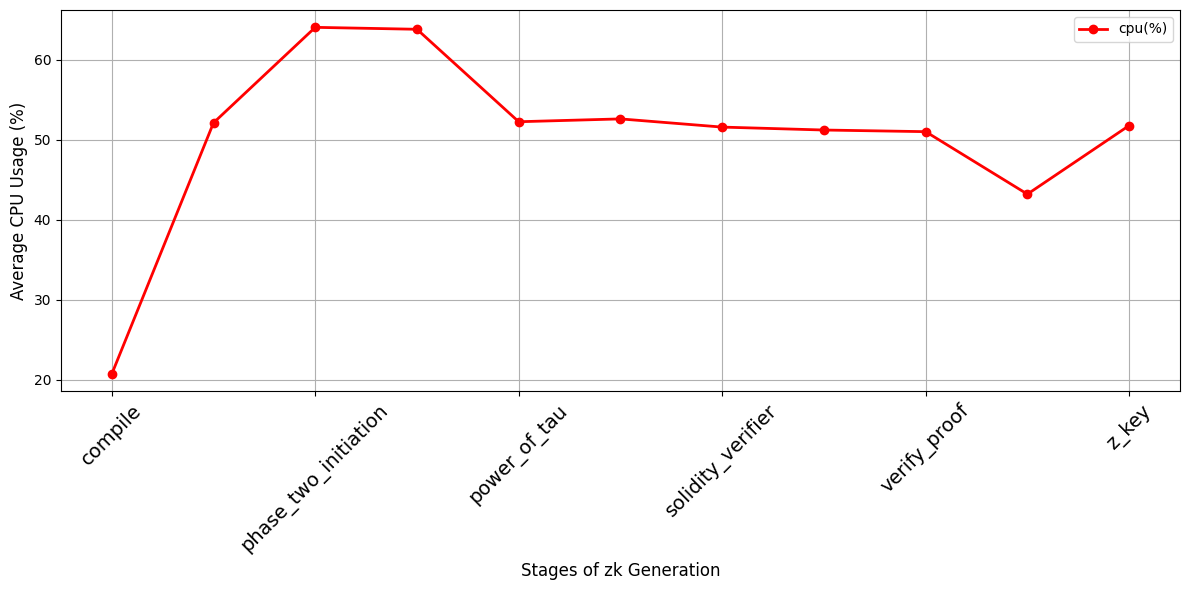
The chart illustrates the average CPU usage (%) across six stages of zk (zero-knowledge) generation. The data is represented by a single red line, with the y-axis ranging from 20% to 60% and the x-axis listing sequential stages of the process.
### Components/Axes
- **X-axis (Stages of zk Generation)**:
- `compile`
- `phase_two_initiation`
- `power_of_tau`
- `solidity_verifier`
- `verify_proof`
- `z_key`
- **Y-axis (Average CPU Usage %)**:
- Scale: 20% to 60% in 10% increments.
- **Legend**:
- Located in the top-right corner.
- Red line labeled `cpu(%)`.
### Detailed Analysis
- **Data Points**:
- `compile`: ~20.5%
- `phase_two_initiation`: ~64.5% (peak)
- `power_of_tau`: ~52.5%
- `solidity_verifier`: ~51.5%
- `verify_proof`: ~50.5%
- `z_key`: ~51.5%
### Key Observations
1. **Sharp Initial Increase**: CPU usage jumps from ~20.5% (`compile`) to ~64.5% (`phase_two_initiation`), indicating a resource-intensive phase.
2. **Post-Spike Stabilization**: After `phase_two_initiation`, CPU usage drops to ~52.5% (`power_of_tau`) and stabilizes between ~50.5%–52.5% for subsequent stages.
3. **Outlier**: The `compile` stage has the lowest CPU usage (~20.5%), contrasting with the peak at `phase_two_initiation`.
4. **Dip at `verify_proof`**: A slight decrease to ~50.5% suggests potential optimization or lower computational demand in this stage.
### Interpretation
- **Resource Allocation**: The spike at `phase_two_initiation` highlights it as the most CPU-heavy stage, possibly involving complex computations (e.g., cryptographic operations).
- **Efficiency Trends**: The stabilization post-spike implies that later stages are optimized or less computationally demanding.
- **Anomaly**: The `compile` stage’s low CPU usage (~20.5%) may reflect preparatory tasks (e.g., code generation) rather than intensive processing.
- **Process Flow**: The chart suggests a workflow where initial stages require heavy resource allocation, followed by a more balanced distribution in later phases.
### Spatial Grounding
- The legend (`cpu(%)`) is positioned in the top-right corner, matching the red line’s color.
- All data points align with the legend’s label, confirming consistency.
### Trend Verification
- The line slopes upward sharply from `compile` to `phase_two_initiation`, then slopes downward to `power_of_tau`, followed by minor fluctuations. This matches the extracted data points.
### Content Details
- No additional text or embedded diagrams are present.
- All values are approximate, with uncertainty due to the absence of gridline markers for precise readings.