## Scatter Plots: Work Effect vs. Work Index and Temperature Effect vs. Temperature
### Overview
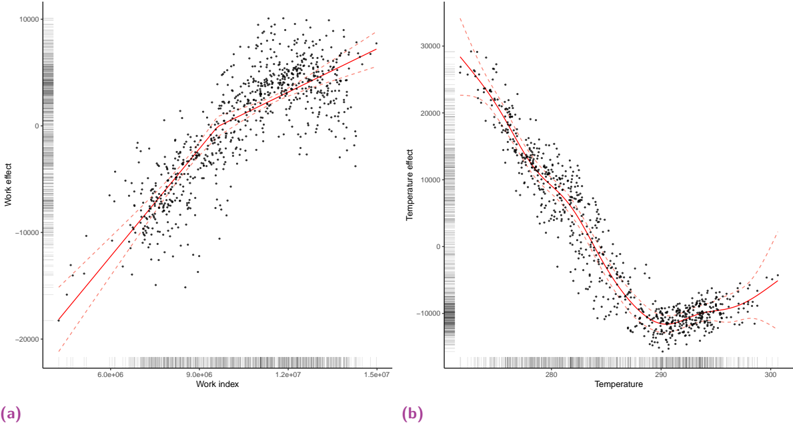
The image contains two scatter plots. Plot (a) shows the relationship between "Work effect" and "Work index," while plot (b) shows the relationship between "Temperature effect" and "Temperature." Both plots include a scatter of data points, a solid red line representing a fitted curve, and dashed red lines indicating confidence intervals.
### Components/Axes
**Plot (a): Work Effect vs. Work Index**
* **X-axis:** "Work index" with scale markers at approximately 6.0e+06, 9.0e+06, 1.2e+07, and 1.5e+07.
* **Y-axis:** "Work effect" with scale markers at -20000, -10000, and 10000.
* Data points are scattered in black.
* A solid red line shows the trend of the data.
* Dashed red lines indicate the confidence interval around the trend line.
**Plot (b): Temperature Effect vs. Temperature**
* **X-axis:** "Temperature" with scale markers at 280, 290, and 300.
* **Y-axis:** "Temperature effect" with scale markers at -10000, 10000, 20000, and 30000.
* Data points are scattered in black.
* A solid red line shows the trend of the data.
* Dashed red lines indicate the confidence interval around the trend line.
### Detailed Analysis
**Plot (a): Work Effect vs. Work Index**
* **Trend:** The "Work effect" generally increases as the "Work index" increases.
* **Data Points:**
* At a "Work index" of approximately 6.0e+06, the "Work effect" is around -20000 to -10000.
* At a "Work index" of approximately 9.0e+06, the "Work effect" is around -5000 to 5000.
* At a "Work index" of approximately 1.2e+07, the "Work effect" is around 5000 to 10000.
* At a "Work index" of approximately 1.5e+07, the "Work effect" is around 5000 to 10000.
* **Confidence Interval:** The confidence interval widens slightly at the higher end of the "Work index."
**Plot (b): Temperature Effect vs. Temperature**
* **Trend:** The "Temperature effect" generally decreases as the "Temperature" increases from 280 to approximately 292, then increases as the "Temperature" increases from 292 to 300.
* **Data Points:**
* At a "Temperature" of approximately 280, the "Temperature effect" is around 20000 to 30000.
* At a "Temperature" of approximately 290, the "Temperature effect" is around 0 to 10000.
* At a "Temperature" of approximately 300, the "Temperature effect" is around 0 to 10000.
* **Confidence Interval:** The confidence interval widens at both ends of the "Temperature" range.
### Key Observations
* Plot (a) shows a positive correlation between "Work effect" and "Work index."
* Plot (b) shows a non-linear relationship between "Temperature effect" and "Temperature," with a minimum "Temperature effect" around a "Temperature" of 292.
### Interpretation
The plots suggest that an increase in "Work index" is associated with an increase in "Work effect." The relationship between "Temperature effect" and "Temperature" is more complex, indicating an optimal temperature range where the "Temperature effect" is minimized. The confidence intervals provide a measure of uncertainty around the estimated trends. The data suggests that the "Work effect" is more predictable based on the "Work index" than the "Temperature effect" is based on "Temperature," as evidenced by the wider confidence intervals in plot (b).