## Bar Chart: Accuracy by Task
### Overview
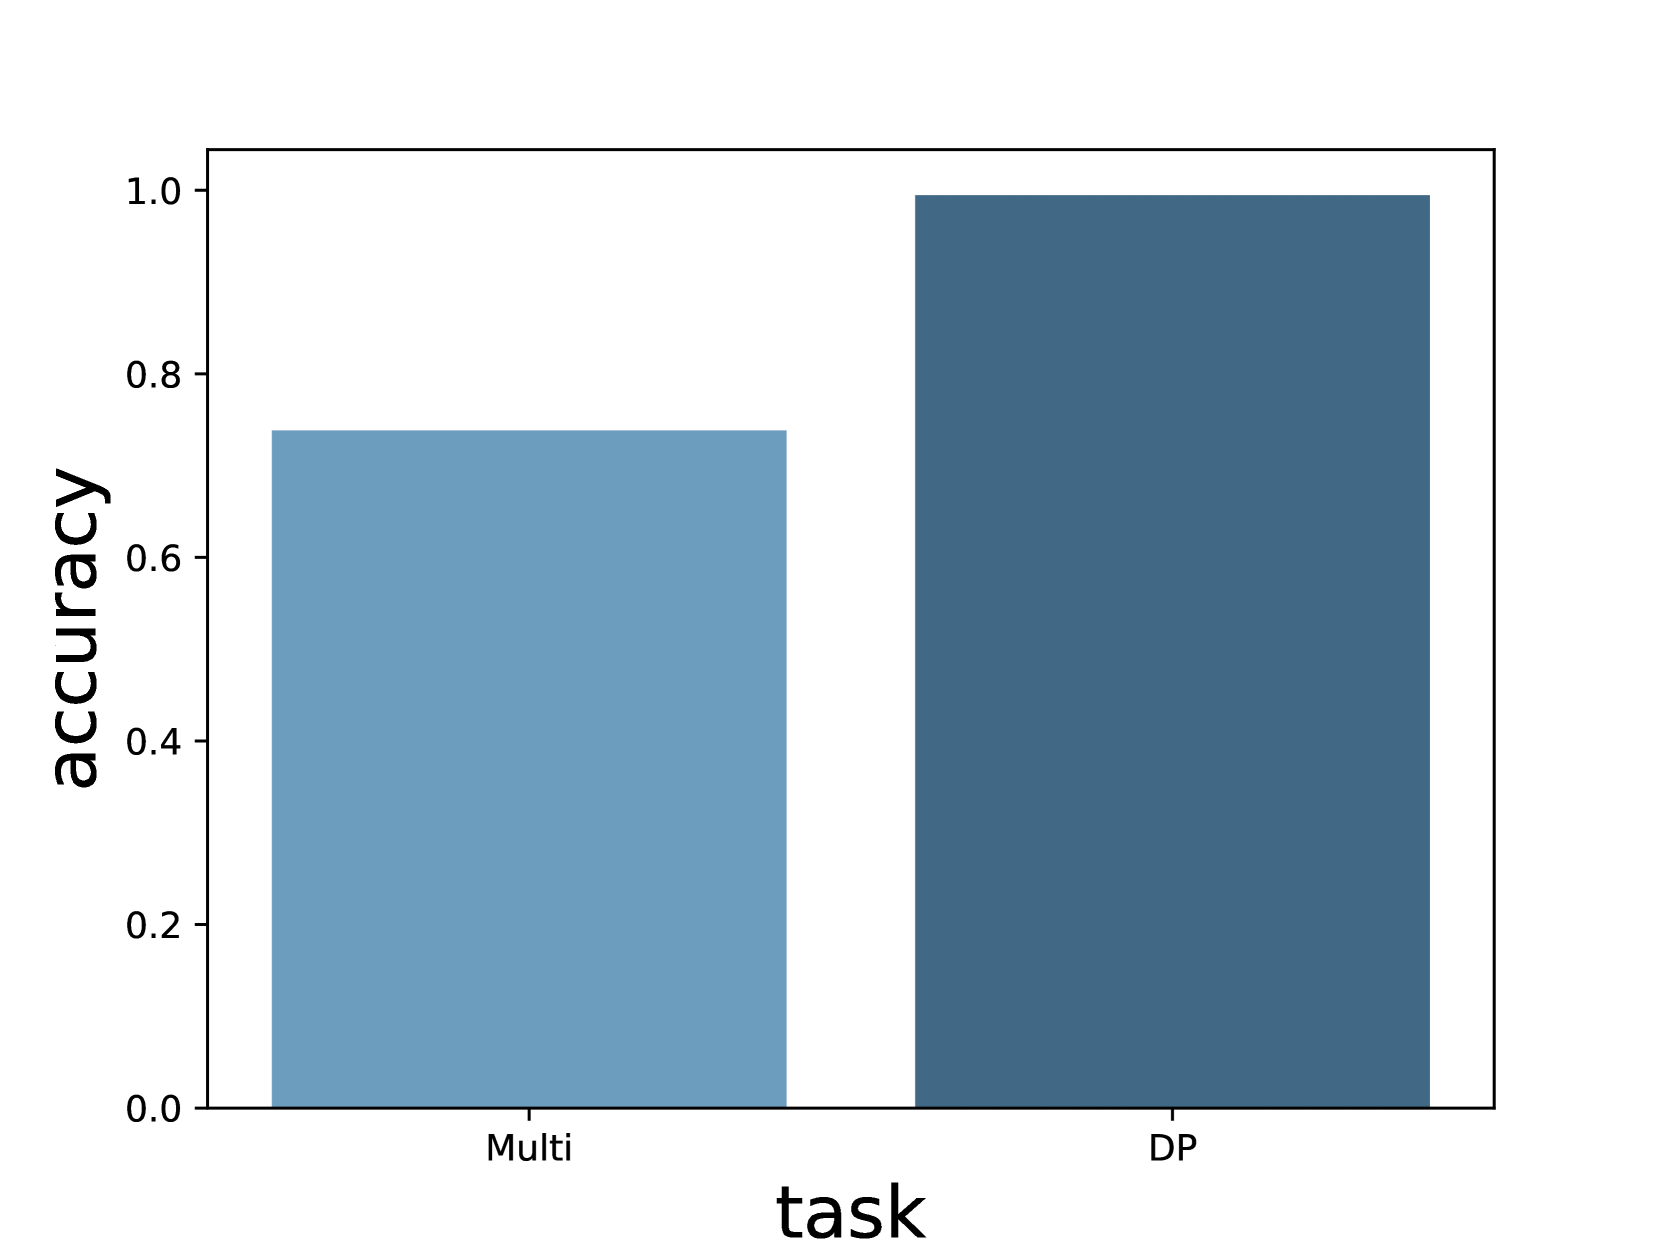
The image is a bar chart comparing the accuracy of two tasks: "Multi" and "DP". The y-axis represents accuracy, ranging from 0.0 to 1.0. The x-axis represents the task type. The bar for "Multi" is a lighter blue, while the bar for "DP" is a darker blue.
### Components/Axes
* **X-axis:** "task" with categories "Multi" and "DP".
* **Y-axis:** "accuracy" ranging from 0.0 to 1.0, with increments of 0.2.
### Detailed Analysis
* **Multi:** The accuracy for the "Multi" task is approximately 0.74.
* **DP:** The accuracy for the "DP" task is approximately 0.99.
### Key Observations
* The "DP" task has a significantly higher accuracy than the "Multi" task.
### Interpretation
The bar chart indicates that the "DP" task is performed with greater accuracy compared to the "Multi" task. The difference in accuracy is substantial, suggesting that the "DP" task may be inherently easier or that the system/method used is better suited for the "DP" task.