## Bar Chart: Accuracy Comparison of Multi and DP Tasks
### Overview
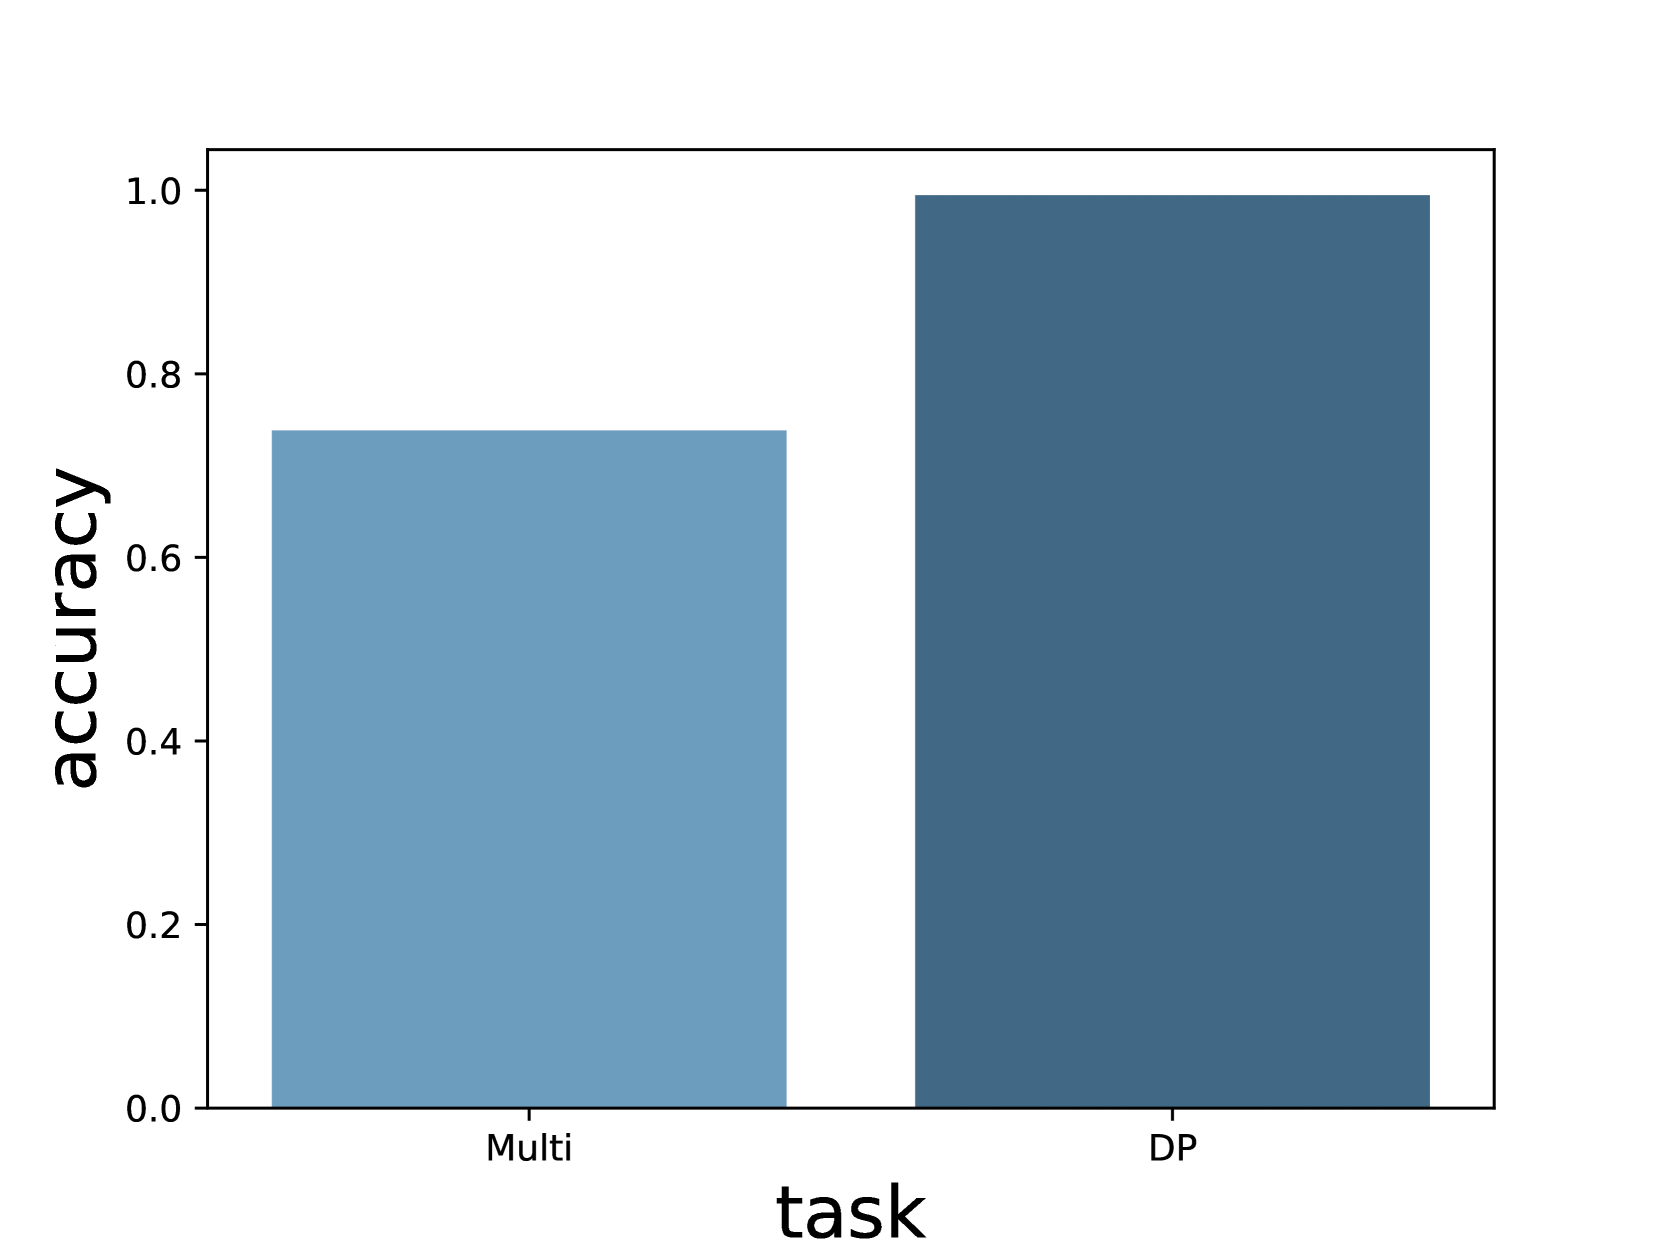
The image is a bar chart comparing the accuracy of two tasks: "Multi" and "DP". The y-axis represents accuracy (ranging from 0.0 to 1.0), and the x-axis categorizes tasks. Two vertical bars are present, one for each task.
### Components/Axes
- **X-axis (task)**: Labeled "task", with two categories:
- "Multi" (left bar)
- "DP" (right bar)
- **Y-axis (accuracy)**: Labeled "accuracy", scaled from 0.0 to 1.0 in increments of 0.2.
- **Legend**: Not visible in the image.
- **Bars**:
- "Multi" bar: Light blue color, height ≈ 0.75.
- "DP" bar: Dark blue color, height ≈ 1.0.
### Detailed Analysis
- **Multi Task**: Accuracy ≈ 0.75 (75%).
- **DP Task**: Accuracy ≈ 1.0 (100%).
- No error bars, annotations, or additional data points are present.
### Key Observations
1. The "DP" task achieves perfect accuracy (1.0), while the "Multi" task has lower accuracy (≈0.75).
2. The "DP" bar is taller than the "Multi" bar, indicating a significant performance gap.
3. No uncertainty ranges or confidence intervals are provided for the values.
### Interpretation
The chart suggests that the "DP" task outperforms the "Multi" task in terms of accuracy. The absence of a legend leaves the color coding (light blue vs. dark blue) ambiguous, but the stark difference in bar heights is visually clear. The lack of error bars or additional context limits the ability to assess statistical significance or variability. This could imply that "DP" is a more reliable or optimized task compared to "Multi", though further data (e.g., sample size, error margins) would strengthen this conclusion.