## Chart: GenPRM Performance as Verifier and Critic
### Overview
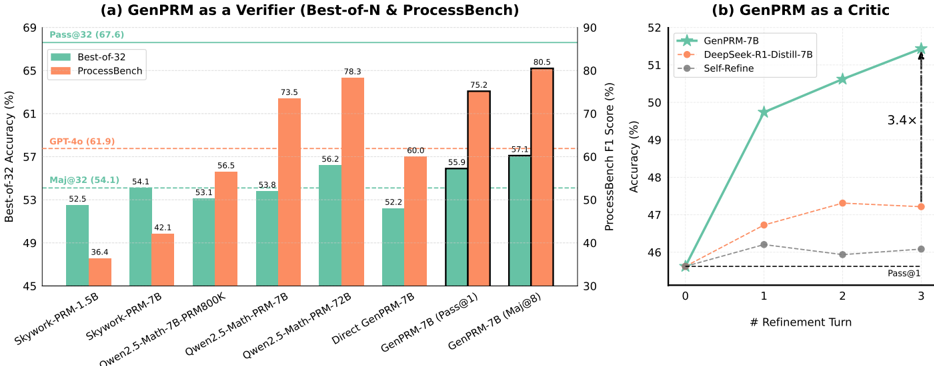
The image presents two charts comparing the performance of GenPRM models. Chart (a) compares GenPRM as a verifier against other models using "Best-of-32 Accuracy" and "ProcessBench F1 Score". Chart (b) evaluates GenPRM as a critic across refinement turns, showing accuracy improvements.
### Components/Axes
**Chart (a): GenPRM as a Verifier**
* **Title:** (a) GenPRM as a Verifier (Best-of-N & ProcessBench)
* **Y-axis (Left):** Best-of-32 Accuracy (%)
* Scale: 45 to 69, incrementing by 4.
* Horizontal lines indicating specific accuracy levels:
* Pass@32 (67.6)
* GPT-4o (61.9)
* Maj@32 (54.1)
* **Y-axis (Right):** ProcessBench F1 Score (%)
* Scale: 30 to 90, incrementing by 10.
* **X-axis:** Model Names
* Categories: Skywork-PRM-1.5B, Skywork-PRM-7B, Qwen2.5-Math-7B-PRM800K, Qwen2.5-Math-PRM-7B, Qwen2.5-Math-PRM-72B, Direct GenPRM-7B, GenPRM-7B (Pass@1), GenPRM-7B (Maj@8)
* **Legend:** Located at the top-left of chart (a).
* Best-of-32 (Teal)
* ProcessBench (Orange)
**Chart (b): GenPRM as a Critic**
* **Title:** (b) GenPRM as a Critic
* **Y-axis:** Accuracy (%)
* Scale: 46 to 52, incrementing by 1.
* **X-axis:** # Refinement Turn
* Scale: 0 to 3, incrementing by 1.
* **Legend:** Located at the top-left of chart (b).
* GenPRM-7B (Teal)
* DeepSeek-R1-Distill-7B (Orange)
* Self-Refine (Gray)
* Pass@1 is indicated on the x-axis at 3.
### Detailed Analysis
**Chart (a): GenPRM as a Verifier**
* **Best-of-32 Accuracy (Teal Bars):**
* Skywork-PRM-1.5B: 52.5%
* Skywork-PRM-7B: 54.1%
* Qwen2.5-Math-7B-PRM800K: 53.1%
* Qwen2.5-Math-PRM-7B: 53.8%
* Qwen2.5-Math-PRM-72B: 56.2%
* Direct GenPRM-7B: 52.2%
* GenPRM-7B (Pass@1): 55.9%
* GenPRM-7B (Maj@8): 57.1%
* **ProcessBench F1 Score (Orange Bars):**
* Skywork-PRM-1.5B: 36.4%
* Skywork-PRM-7B: 42.1%
* Qwen2.5-Math-7B-PRM800K: 56.5%
* Qwen2.5-Math-PRM-7B: 73.5%
* Qwen2.5-Math-PRM-72B: 78.3%
* Direct GenPRM-7B: 60.0%
* GenPRM-7B (Pass@1): 75.2%
* GenPRM-7B (Maj@8): 80.5%
**Chart (b): GenPRM as a Critic**
* **GenPRM-7B (Teal Line with Star Markers):** The line slopes upward.
* Refinement Turn 0: 46%
* Refinement Turn 1: 49.5%
* Refinement Turn 2: 50.5%
* Refinement Turn 3: 52%
* **DeepSeek-R1-Distill-7B (Orange Dashed Line with Circle Markers):** The line is relatively flat.
* Refinement Turn 0: 46%
* Refinement Turn 1: 47.3%
* Refinement Turn 2: 47.4%
* Refinement Turn 3: 47.4%
* **Self-Refine (Gray Dashed Line with Circle Markers):** The line is relatively flat.
* Refinement Turn 0: 46%
* Refinement Turn 1: 46%
* Refinement Turn 2: 45.9%
* Refinement Turn 3: 46.1%
### Key Observations
* In Chart (a), ProcessBench F1 scores are generally higher than Best-of-32 Accuracy for most models.
* In Chart (b), GenPRM-7B shows a significant increase in accuracy with refinement turns, indicated by "3.4x" between turn 0 and turn 3. DeepSeek-R1-Distill-7B and Self-Refine show minimal improvement with refinement.
### Interpretation
The charts suggest that GenPRM performs well both as a verifier and as a critic. As a verifier, its performance varies depending on the evaluation metric (Best-of-32 vs. ProcessBench). As a critic, GenPRM-7B demonstrates a substantial improvement in accuracy with increasing refinement turns, outperforming DeepSeek-R1-Distill-7B and Self-Refine. The "3.4x" annotation highlights the significant impact of refinement on GenPRM-7B's performance. The data indicates that GenPRM-7B benefits significantly from iterative refinement, suggesting its effectiveness in improving model accuracy through self-critique.