\n
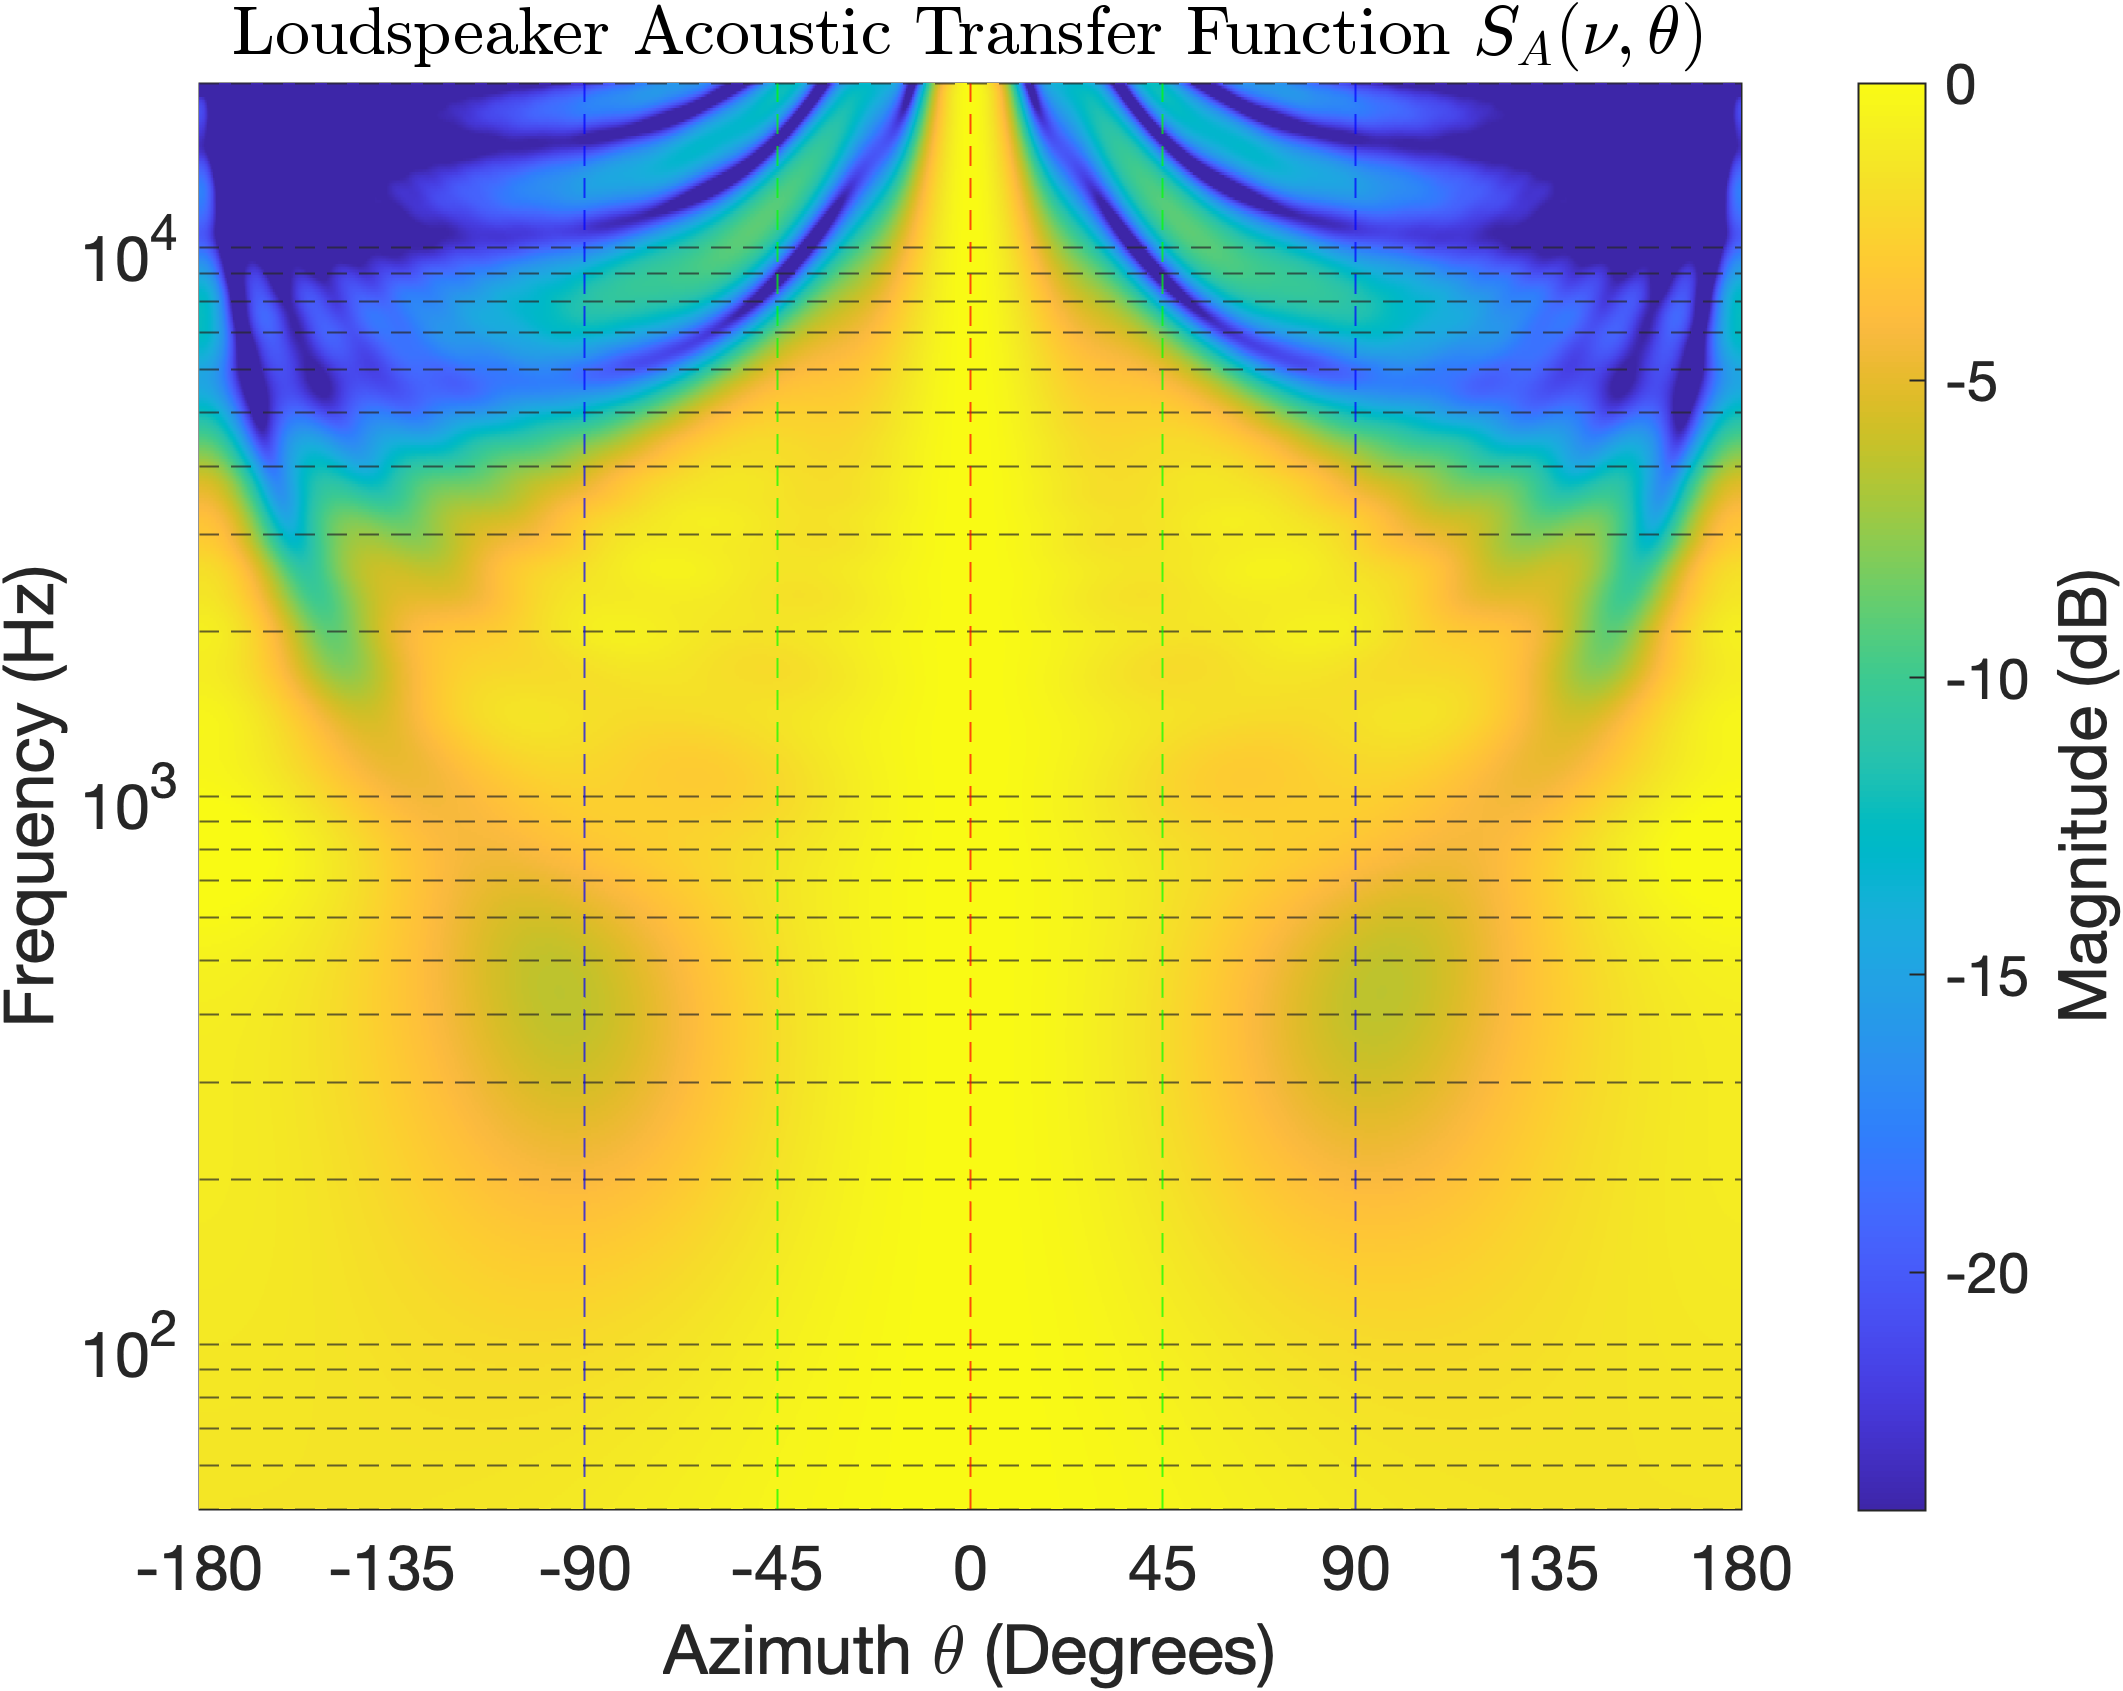
## Heatmap: Loudspeaker Acoustic Transfer Function
### Overview
The image presents a 2D heatmap visualizing the Loudspeaker Acoustic Transfer Function S<sub>A</sub>(ν, θ). The heatmap displays the magnitude in decibels (dB) as a function of frequency (ν) and azimuth angle (θ). The color gradient represents the magnitude, ranging from 0 dB (red) to -20 dB (blue).
### Components/Axes
* **Title:** Loudspeaker Acoustic Transfer Function S<sub>A</sub>(ν, θ) - positioned at the top-center.
* **X-axis:** Azimuth θ (Degrees) - ranging from -180 to 180 degrees, with tick marks at -180, -135, -90, -45, 0, 45, 90, 135, and 180 degrees.
* **Y-axis:** Frequency (Hz) - displayed on a logarithmic scale, with tick marks at 10<sup>2</sup>, 10<sup>3</sup>, and 10<sup>4</sup> Hz.
* **Colorbar:** Located on the right side of the heatmap, representing Magnitude (dB). The colorbar ranges from 0 dB (red) to -20 dB (blue), with intermediate values indicated by color gradients.
### Detailed Analysis
The heatmap shows a complex pattern of acoustic transfer function magnitude across frequency and azimuth.
* **High Frequencies (around 10<sup>4</sup> Hz):** A narrow, intense peak is visible at 0 degrees azimuth. The magnitude is approximately 0 dB (red). The magnitude decreases rapidly as the azimuth angle moves away from 0 degrees in either direction.
* **Mid Frequencies (around 10<sup>3</sup> Hz):** Two peaks are visible, one around -45 degrees and another around 45 degrees. The magnitude at these peaks is approximately -5 dB (yellow-orange). There is a dip in magnitude around 0 degrees, with values around -10 dB (green).
* **Low Frequencies (around 10<sup>2</sup> Hz):** The magnitude is generally low across all azimuth angles. The magnitude ranges from approximately -15 dB (light green) to -20 dB (blue). There is a slight increase in magnitude towards the -90 and 90 degree azimuths, reaching approximately -10 dB (green).
* **Azimuth -180 to 180 degrees:** The magnitude generally decreases as the azimuth angle moves away from 0 degrees at higher frequencies. At lower frequencies, the magnitude is relatively consistent across all azimuth angles.
* **Frequency 10<sup>2</sup> to 10<sup>4</sup> Hz:** The magnitude generally increases with frequency, particularly around 0 degrees azimuth.
### Key Observations
* The loudspeaker exhibits a highly directional response at high frequencies, with maximum output at 0 degrees azimuth.
* The acoustic transfer function is more omnidirectional at low frequencies.
* There are noticeable nulls (areas of low magnitude) in the acoustic transfer function at certain frequencies and azimuth angles.
* The response is approximately symmetrical around the 0-degree azimuth.
### Interpretation
The heatmap demonstrates the frequency-dependent directivity of the loudspeaker. At higher frequencies, the sound is focused in a narrow beam, while at lower frequencies, the sound radiates more broadly. This behavior is typical of many loudspeakers, where the wavelength of the sound is comparable to the size of the speaker diaphragm. The nulls in the acoustic transfer function likely correspond to destructive interference patterns caused by the speaker's geometry and the surrounding environment. The data suggests that the loudspeaker is optimized for projecting sound directly forward (0 degrees azimuth) at high frequencies. The logarithmic scale on the y-axis emphasizes the relative changes in magnitude across different frequencies, highlighting the significant drop in magnitude at lower frequencies. The colorbar provides a clear visual representation of the magnitude scale, allowing for easy interpretation of the heatmap data.