## 2D Line Plot: EFER
### Overview
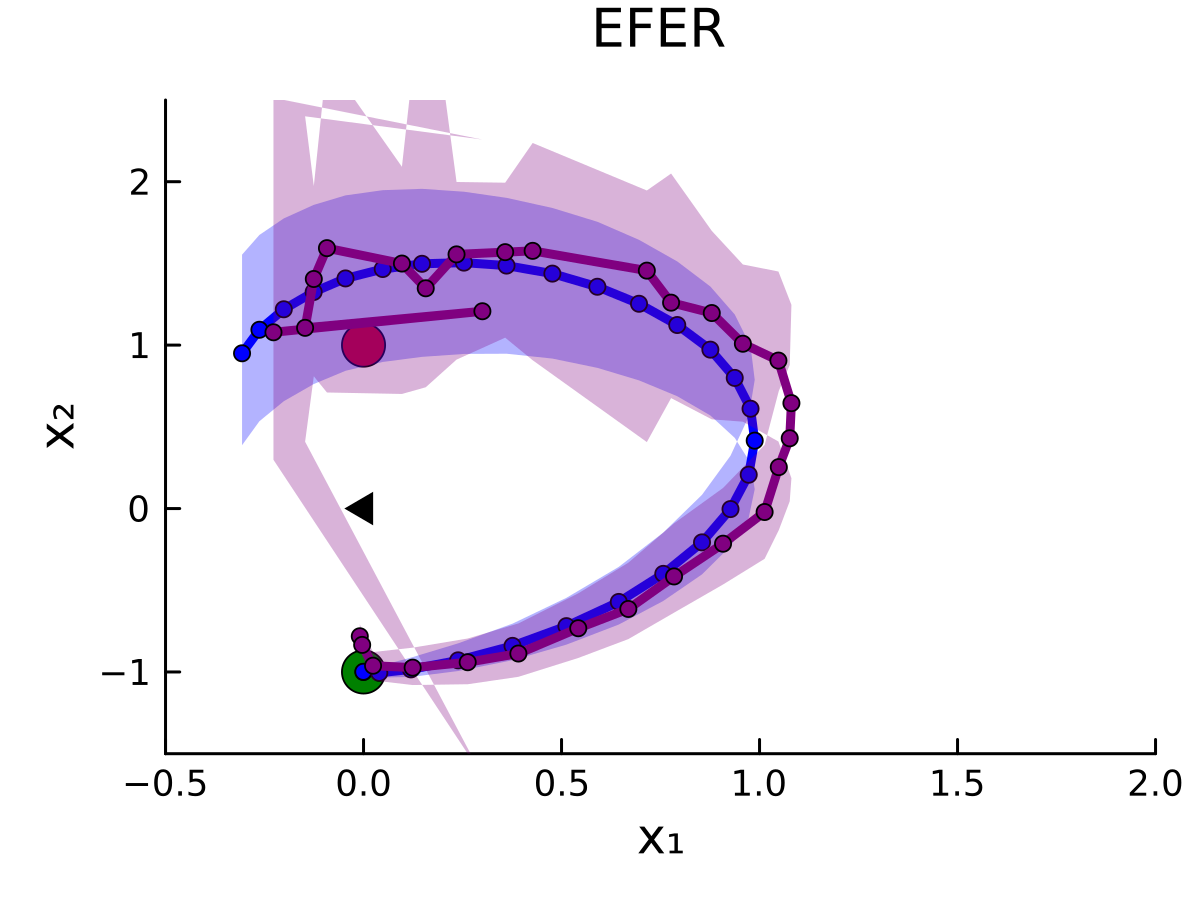
The image displays a 2D coordinate plot titled "EFER". It visualizes two distinct trajectories or data series (blue and purple) plotted against axes labeled X1 and X2. The plot illustrates the path of these series as they evolve from an upper starting position toward a common terminal point near the bottom center. The plot includes shaded regions representing variance or uncertainty, as well as specific marker symbols.
### Components/Axes
* **Title:** "EFER" (centered at the top).
* **X-axis:** Labeled "X1". The scale ranges from -0.5 to 2.0, with major ticks at 0.0, 0.5, 1.0, 1.5, and 2.0.
* **Y-axis:** Labeled "X2". The scale ranges from -1 to 2, with major ticks at -1, 0, 1, and 2.
* **Data Series 1 (Blue):** A smooth, continuous line with blue circular markers. It is accompanied by a light blue shaded region representing the variance/confidence interval.
* **Data Series 2 (Purple):** A jagged, erratic line with purple circular markers. It is accompanied by a light purple shaded region representing the variance/confidence interval.
* **Reference Markers:**
* **Green Circle:** Located at approximately (0, -1).
* **Purple Circle:** Located at approximately (0, 1).
* **Black Triangle:** Located at approximately (0, 0), pointing to the right.
### Detailed Analysis
#### Trend Verification
* **Blue Series:** The line exhibits a smooth, parabolic-like arc. It begins at approximately (-0.3, 1.0), curves upward to a peak near (0.3, 1.5), and then descends in a consistent, smooth arc, crossing the X1=1.0, X2=0.5 coordinate, and terminating at approximately (0, -1.0).
* **Purple Series:** The line exhibits high volatility. It begins near (0, 1.6) and moves erratically in the upper-left quadrant. It then follows a downward trajectory that roughly parallels the blue line, eventually converging toward the same terminal point near (0, -0.9).
#### Spatial Grounding & Data Points
* **Upper Region (X2 > 0):** The purple series shows significant deviation from the blue series. The purple shaded region is wide and irregular, indicating high uncertainty or exploration in this phase.
* **Lower Region (X2 < 0):** Both lines converge tightly toward the green circle at (0, -1). The shaded regions narrow significantly as they approach this point, suggesting that the system becomes more deterministic or stable as it reaches the target.
* **Markers:**
* The **Purple Circle** at (0, 1) sits slightly below the starting point of the purple line.
* The **Black Triangle** at (0, 0) acts as a central reference point, positioned between the start and end of the trajectories.
* The **Green Circle** at (0, -1) serves as the clear destination or "goal" state for both trajectories.
### Key Observations
* **Convergence:** Despite the high variance and erratic path of the purple series, both data series converge to the same coordinate (0, -1).
* **Volatility Differential:** The purple series is significantly more "noisy" than the blue series. This is visually represented by the jagged line and the wide, irregular purple shaded region.
* **Stability:** The blue series represents a stable, optimized path, while the purple series represents a less stable, potentially exploratory or stochastic process.
### Interpretation
The data suggests this is a visualization of a reinforcement learning agent or a control system trajectory.
* **The Blue Line** likely represents the "mean" or "optimal" policy/trajectory, characterized by smoothness and low variance.
* **The Purple Line** likely represents a "noisy" or "exploratory" policy, where the agent is testing different actions (hence the jaggedness and wide shaded region) before eventually converging on the optimal path.
* **The Goal:** The convergence at the green circle (0, -1) indicates that both the optimal and exploratory agents successfully reach the target state. The plot demonstrates the transition from high-uncertainty exploration (top of the graph) to high-certainty exploitation (bottom of the graph). The "EFER" title may refer to an algorithm or metric related to "Expected Future..." or a specific reinforcement learning framework.