## Chart: Entropy and Attention Proportion vs. Generation Step
### Overview
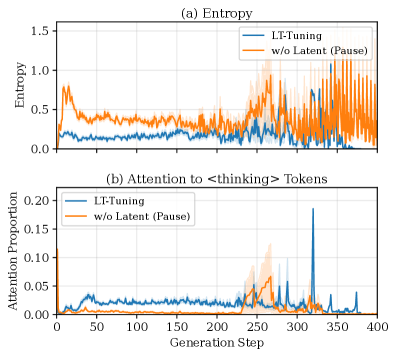
The image presents two line charts comparing "LT-Tuning" and "w/o Latent (Pause)" models. The top chart (a) displays Entropy versus Generation Step, while the bottom chart (b) shows Attention Proportion to `<thinking>` Tokens versus Generation Step. Both charts span a Generation Step range from 0 to 400.
### Components/Axes
**Top Chart (a) Entropy:**
* **Title:** (a) Entropy
* **Y-axis:** Entropy, with scale from 0.0 to 1.5, increments of 0.5.
* **X-axis:** Generation Step (shared with the bottom chart).
* **Legend (Top-Right):**
* Blue Line: LT-Tuning
* Orange Line: w/o Latent (Pause)
**Bottom Chart (b) Attention to `<thinking>` Tokens:**
* **Title:** (b) Attention to `<thinking>` Tokens
* **Y-axis:** Attention Proportion, with scale from 0.00 to 0.20, increments of 0.05.
* **X-axis:** Generation Step, with scale from 0 to 400, increments of 50.
* **Legend (Top-Left):**
* Blue Line: LT-Tuning
* Orange Line: w/o Latent (Pause)
### Detailed Analysis
**Top Chart (a) Entropy:**
* **LT-Tuning (Blue):**
* Trend: Starts around 0.2, rises to approximately 0.8 around step 50, then decreases and fluctuates between 0.2 and 0.4 until around step 250. After step 250, it increases with high variance.
* Approximate Values:
* Step 0: ~0.2
* Step 50: ~0.8
* Step 200: ~0.2
* Step 300: ~0.4
* **w/o Latent (Pause) (Orange):**
* Trend: Starts around 0.1, rises to approximately 0.5 around step 50, then gradually decreases and fluctuates between 0.3 and 0.5 until around step 250. After step 250, it increases with high variance and periodic spikes.
* Approximate Values:
* Step 0: ~0.1
* Step 50: ~0.5
* Step 200: ~0.3
* Step 300: ~0.5
**Bottom Chart (b) Attention to `<thinking>` Tokens:**
* **LT-Tuning (Blue):**
* Trend: Starts near 0.0, rises to approximately 0.04 around step 50, then fluctuates between 0.01 and 0.03 until around step 250. After step 250, it shows several spikes, reaching up to 0.2 around step 300.
* Approximate Values:
* Step 0: ~0.0
* Step 50: ~0.04
* Step 200: ~0.02
* Step 300: ~0.2
* **w/o Latent (Pause) (Orange):**
* Trend: Starts near 0.1, decreases to approximately 0.01 around step 50, then fluctuates between 0.0 and 0.02 until around step 250. After step 250, it shows a slight increase with some variance.
* Approximate Values:
* Step 0: ~0.1
* Step 50: ~0.01
* Step 200: ~0.01
* Step 300: ~0.03
### Key Observations
* In the Entropy chart, both models exhibit a similar initial rise and subsequent decline until around step 250. After step 250, both models show increased variance.
* In the Attention Proportion chart, the "LT-Tuning" model shows significant spikes in attention to `<thinking>` tokens after step 250, while the "w/o Latent (Pause)" model remains relatively stable.
* The "w/o Latent (Pause)" model has a higher initial attention proportion but stabilizes at a lower level compared to the "LT-Tuning" model.
### Interpretation
The charts suggest that the "LT-Tuning" model and the "w/o Latent (Pause)" model behave differently in terms of entropy and attention to `<thinking>` tokens, especially after a certain number of generation steps (around 250). The "LT-Tuning" model shows increased attention to `<thinking>` tokens, which could indicate a change in its processing or decision-making. The higher entropy observed in both models after step 250 suggests increased uncertainty or variability in their outputs. The latent pause mechanism seems to stabilize the attention proportion, preventing the spikes observed in the LT-Tuning model.