\n
## Line Chart: Entropy and Attention to <thinking> Tokens
### Overview
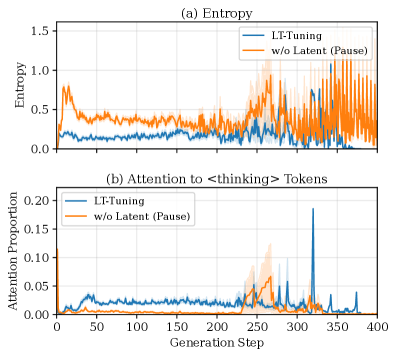
The image presents two line charts stacked vertically. The top chart displays "Entropy" versus "Generation Step" for two conditions: "LT-Tuning" and "w/o Latent (Pause)". The bottom chart shows "Attention Proportion" to "<thinking>" tokens against "Generation Step", also for the same two conditions. Both charts share the same x-axis (Generation Step) ranging from 0 to 400.
### Components/Axes
* **X-axis:** "Generation Step" (Scale: 0 to 400, increments of 50)
* **Top Chart Y-axis:** "Entropy" (Scale: 0 to 1.5, increments of 0.25)
* **Bottom Chart Y-axis:** "Attention Proportion" (Scale: 0 to 0.20, increments of 0.05)
* **Legend (Top-Left of each chart):**
* Blue Line: "LT-Tuning"
* Orange Line: "w/o Latent (Pause)"
* **Chart Titles:**
* (a) Entropy (Top Chart)
* (b) Attention to <thinking> Tokens (Bottom Chart)
### Detailed Analysis or Content Details
**Chart (a) - Entropy:**
The blue line ("LT-Tuning") starts at approximately 0.6, decreases to a minimum of around 0.15 at Generation Step 100, and then fluctuates between 0.1 and 0.3 until Generation Step 300. After Generation Step 300, it shows a slight increase, reaching approximately 0.25 at Generation Step 400.
The orange line ("w/o Latent (Pause)") begins at approximately 0.5, remains relatively stable around 0.5-0.7 until Generation Step 200. From Generation Step 200 to 300, it exhibits a significant increase, peaking at around 1.2 at Generation Step 250. After Generation Step 300, it rapidly decreases, fluctuating between 0.5 and 0.9 until Generation Step 400. The orange line has a shaded area representing standard deviation.
**Chart (b) - Attention to <thinking> Tokens:**
The blue line ("LT-Tuning") starts at approximately 0.03, fluctuates around 0.03-0.06 until Generation Step 250. Around Generation Step 350, there is a sharp spike to approximately 0.18, then quickly drops back to around 0.05 by Generation Step 400.
The orange line ("w/o Latent (Pause)") begins at approximately 0.02, remains relatively stable around 0.02-0.05 until Generation Step 250. It then shows a gradual increase, peaking at around 0.10 at Generation Step 300, and then decreases to approximately 0.04 by Generation Step 400. The orange line has a shaded area representing standard deviation.
### Key Observations
* The "w/o Latent (Pause)" condition exhibits significantly higher entropy values than the "LT-Tuning" condition, particularly between Generation Steps 200 and 300.
* The "LT-Tuning" condition shows a more stable and lower entropy throughout the generation process.
* Both conditions show a spike in attention to "<thinking>" tokens around Generation Step 350, but the spike is much more pronounced for the "LT-Tuning" condition.
* The standard deviation is larger for the "w/o Latent (Pause)" condition, indicating more variability in the entropy and attention values.
### Interpretation
The data suggests that the "LT-Tuning" method leads to a more predictable and controlled generation process, as evidenced by the lower and more stable entropy values. The higher entropy observed in the "w/o Latent (Pause)" condition indicates greater uncertainty or randomness in the generation process.
The attention to "<thinking>" tokens suggests that both methods utilize this token during generation, but the "LT-Tuning" method exhibits a more focused and potentially more effective use of this token, as indicated by the larger spike in attention proportion around Generation Step 350. This could imply that the LT-Tuning method is better at leveraging internal "thinking" steps during the generation process.
The difference in entropy and attention patterns between the two conditions highlights the benefits of incorporating latent tuning in the generation process, potentially leading to more coherent and controlled outputs. The larger standard deviation for the "w/o Latent (Pause)" condition suggests that the results are less consistent and more prone to variation.