# Technical Document Extraction: Image Analysis
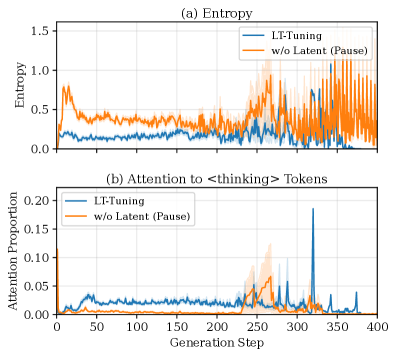
## Chart (a): Entropy
### Labels and Axes
- **X-Axis**: Generation Step (0 to 400)
- **Y-Axis**: Entropy (0.0 to 1.5)
- **Legend**: Located at the top-right corner of the chart.
### Data Series
1. **LT-Tuning** (Blue Line)
- **Trend**: Smooth, low-volatility trajectory. Entropy remains consistently below 0.5 for most of the generation steps, with minor fluctuations.
- **Key Data Points**:
- At Generation Step 0: ~0.3
- At Generation Step 100: ~0.4
- At Generation Step 200: ~0.35
- At Generation Step 300: ~0.4
- At Generation Step 400: ~0.3
2. **w/o Latent (Pause)** (Orange Line)
- **Trend**: High-volatility trajectory. Entropy spikes frequently, reaching up to ~1.5, with significant oscillations.
- **Key Data Points**:
- At Generation Step 0: ~0.6
- At Generation Step 100: ~0.7
- At Generation Step 200: ~1.2
- At Generation Step 300: ~0.9
- At Generation Step 400: ~1.4
### Observations
- The blue line (LT-Tuning) demonstrates stable entropy, suggesting controlled generation dynamics.
- The orange line (w/o Latent) exhibits erratic behavior, indicating instability in the generation process.
---
## Chart (b): Attention to `<thinking>` Tokens
### Labels and Axes
- **X-Axis**: Generation Step (0 to 400)
- **Y-Axis**: Attention Proportion (0.0 to 0.2)
- **Legend**: Located at the top-right corner of the chart.
### Data Series
1. **LT-Tuning** (Blue Line)
- **Trend**: Stable with a sharp peak at Generation Step 300.
- **Key Data Points**:
- At Generation Step 0: ~0.05
- At Generation Step 100: ~0.03
- At Generation Step 200: ~0.02
- At Generation Step 300: ~0.18
- At Generation Step 400: ~0.02
2. **w/o Latent (Pause)** (Orange Line)
- **Trend**: Stable with a sharp peak at Generation Step 250.
- **Key Data Points**:
- At Generation Step 0: ~0.01
- At Generation Step 100: ~0.01
- At Generation Step 200: ~0.01
- At Generation Step 250: ~0.15
- At Generation Step 400: ~0.01
### Observations
- Both lines show minimal attention to `<thinking>` tokens until late-generation steps.
- LT-Tuning exhibits a delayed but pronounced spike at Step 300, while w/o Latent peaks earlier at Step 250.
---
## Spatial Grounding and Validation
- **Legend Placement**: Top-right corner for both charts.
- **Color Consistency**:
- Blue lines correspond to **LT-Tuning** in both charts.
- Orange lines correspond to **w/o Latent (Pause)** in both charts.
- **Axis Alignment**: X-axis (Generation Step) and Y-axis labels match across both charts.
## Conclusion
The charts compare the performance of two generation strategies (LT-Tuning vs. w/o Latent) across entropy and attention metrics. LT-Tuning demonstrates superior stability in entropy and controlled attention spikes, while w/o Latent exhibits higher entropy and earlier but less sustained attention to `<thinking>` tokens.