## Quantum State Diagrams and Cavity Setup
### Overview
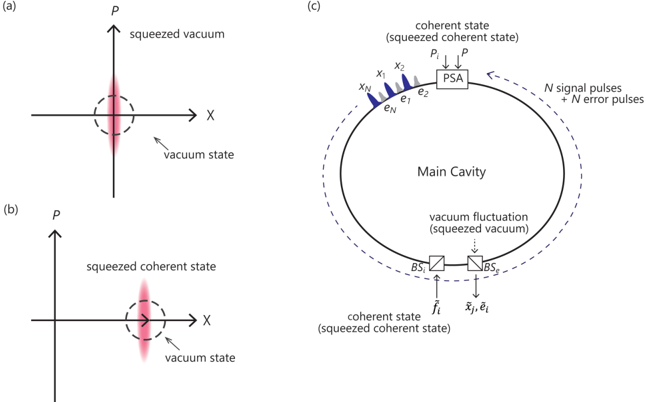
The image presents three diagrams illustrating quantum states and a cavity setup. Diagrams (a) and (b) depict squeezed vacuum and squeezed coherent states in phase space, respectively. Diagram (c) shows a cavity setup involving a PSA (Phase Sensitive Amplifier), beam splitters (BS), and signal/error pulses.
### Components/Axes
**Diagram (a): Squeezed Vacuum**
* **Axes:**
* X-axis labeled "X"
* Y-axis labeled "P"
* **Annotations:**
* "squeezed vacuum" (located at the top-right of the plot)
* "vacuum state" (located at the bottom-right of the plot, pointing to a dashed circle at the origin)
* **Data:** A vertically elongated, red-shaded region centered at the origin.
**Diagram (b): Squeezed Coherent State**
* **Axes:**
* X-axis labeled "X"
* Y-axis labeled "P"
* **Annotations:**
* "squeezed coherent state" (located at the top-right of the plot)
* "vacuum state" (located at the bottom-right of the plot, pointing to a dashed circle at the origin)
* **Data:** A horizontally elongated, red-shaded region centered on the X-axis, slightly offset from the origin.
**Diagram (c): Cavity Setup**
* **Components:**
* "Main Cavity": A large circle representing the cavity.
* "PSA": Phase Sensitive Amplifier, a rectangular box at the top of the cavity.
* "BS": Beam Splitters, two boxes at the bottom of the cavity.
* Input pulses: x1, x2, ..., xN, e1, e2, ..., eN entering the PSA.
* **Annotations:**
* "coherent state (squeezed coherent state)": Located above the PSA.
* "N signal pulses + N error pulses": Located to the right of the PSA, with an arrow indicating the direction of pulse propagation within the cavity.
* "vacuum fluctuation (squeezed vacuum)": Located below the main cavity.
* "coherent state (squeezed coherent state)": Located below the beam splitters.
* **Flow:** Pulses enter the PSA, circulate within the cavity (indicated by arrows), and interact with beam splitters.
### Detailed Analysis
**Diagram (a): Squeezed Vacuum**
* The squeezed vacuum state is represented by a probability distribution that is squeezed along the X-axis and elongated along the P-axis. This indicates reduced uncertainty in the X quadrature at the expense of increased uncertainty in the P quadrature. The dashed circle represents the vacuum state.
**Diagram (b): Squeezed Coherent State**
* The squeezed coherent state is similar to the squeezed vacuum state but is displaced from the origin along the X-axis. This indicates a non-zero mean value for the X quadrature.
**Diagram (c): Cavity Setup**
* The cavity setup involves a PSA that amplifies the signal pulses while suppressing the error pulses. The beam splitters are used to extract the coherent state from the cavity. The vacuum fluctuation represents the quantum noise within the cavity.
* The input pulses are labeled as x1, x2, ..., xN (signal pulses) and e1, e2, ..., eN (error pulses).
* The output from the beam splitters is labeled as f_i and x_i, e_i.
### Key Observations
* Diagrams (a) and (b) illustrate the concept of squeezing in quantum states, where uncertainty in one quadrature is reduced at the expense of increased uncertainty in the other.
* Diagram (c) shows a cavity setup designed to process quantum signals using a PSA and beam splitters.
### Interpretation
The image illustrates the manipulation of quantum states within a cavity. Squeezed states are used to reduce quantum noise and improve the sensitivity of quantum measurements. The cavity setup is designed to amplify signal pulses while suppressing error pulses, which is crucial for quantum communication and computation. The use of squeezed vacuum and squeezed coherent states suggests a strategy to enhance the signal-to-noise ratio in quantum information processing.