## Chart Type: Bar Chart with Error Bars
### Overview
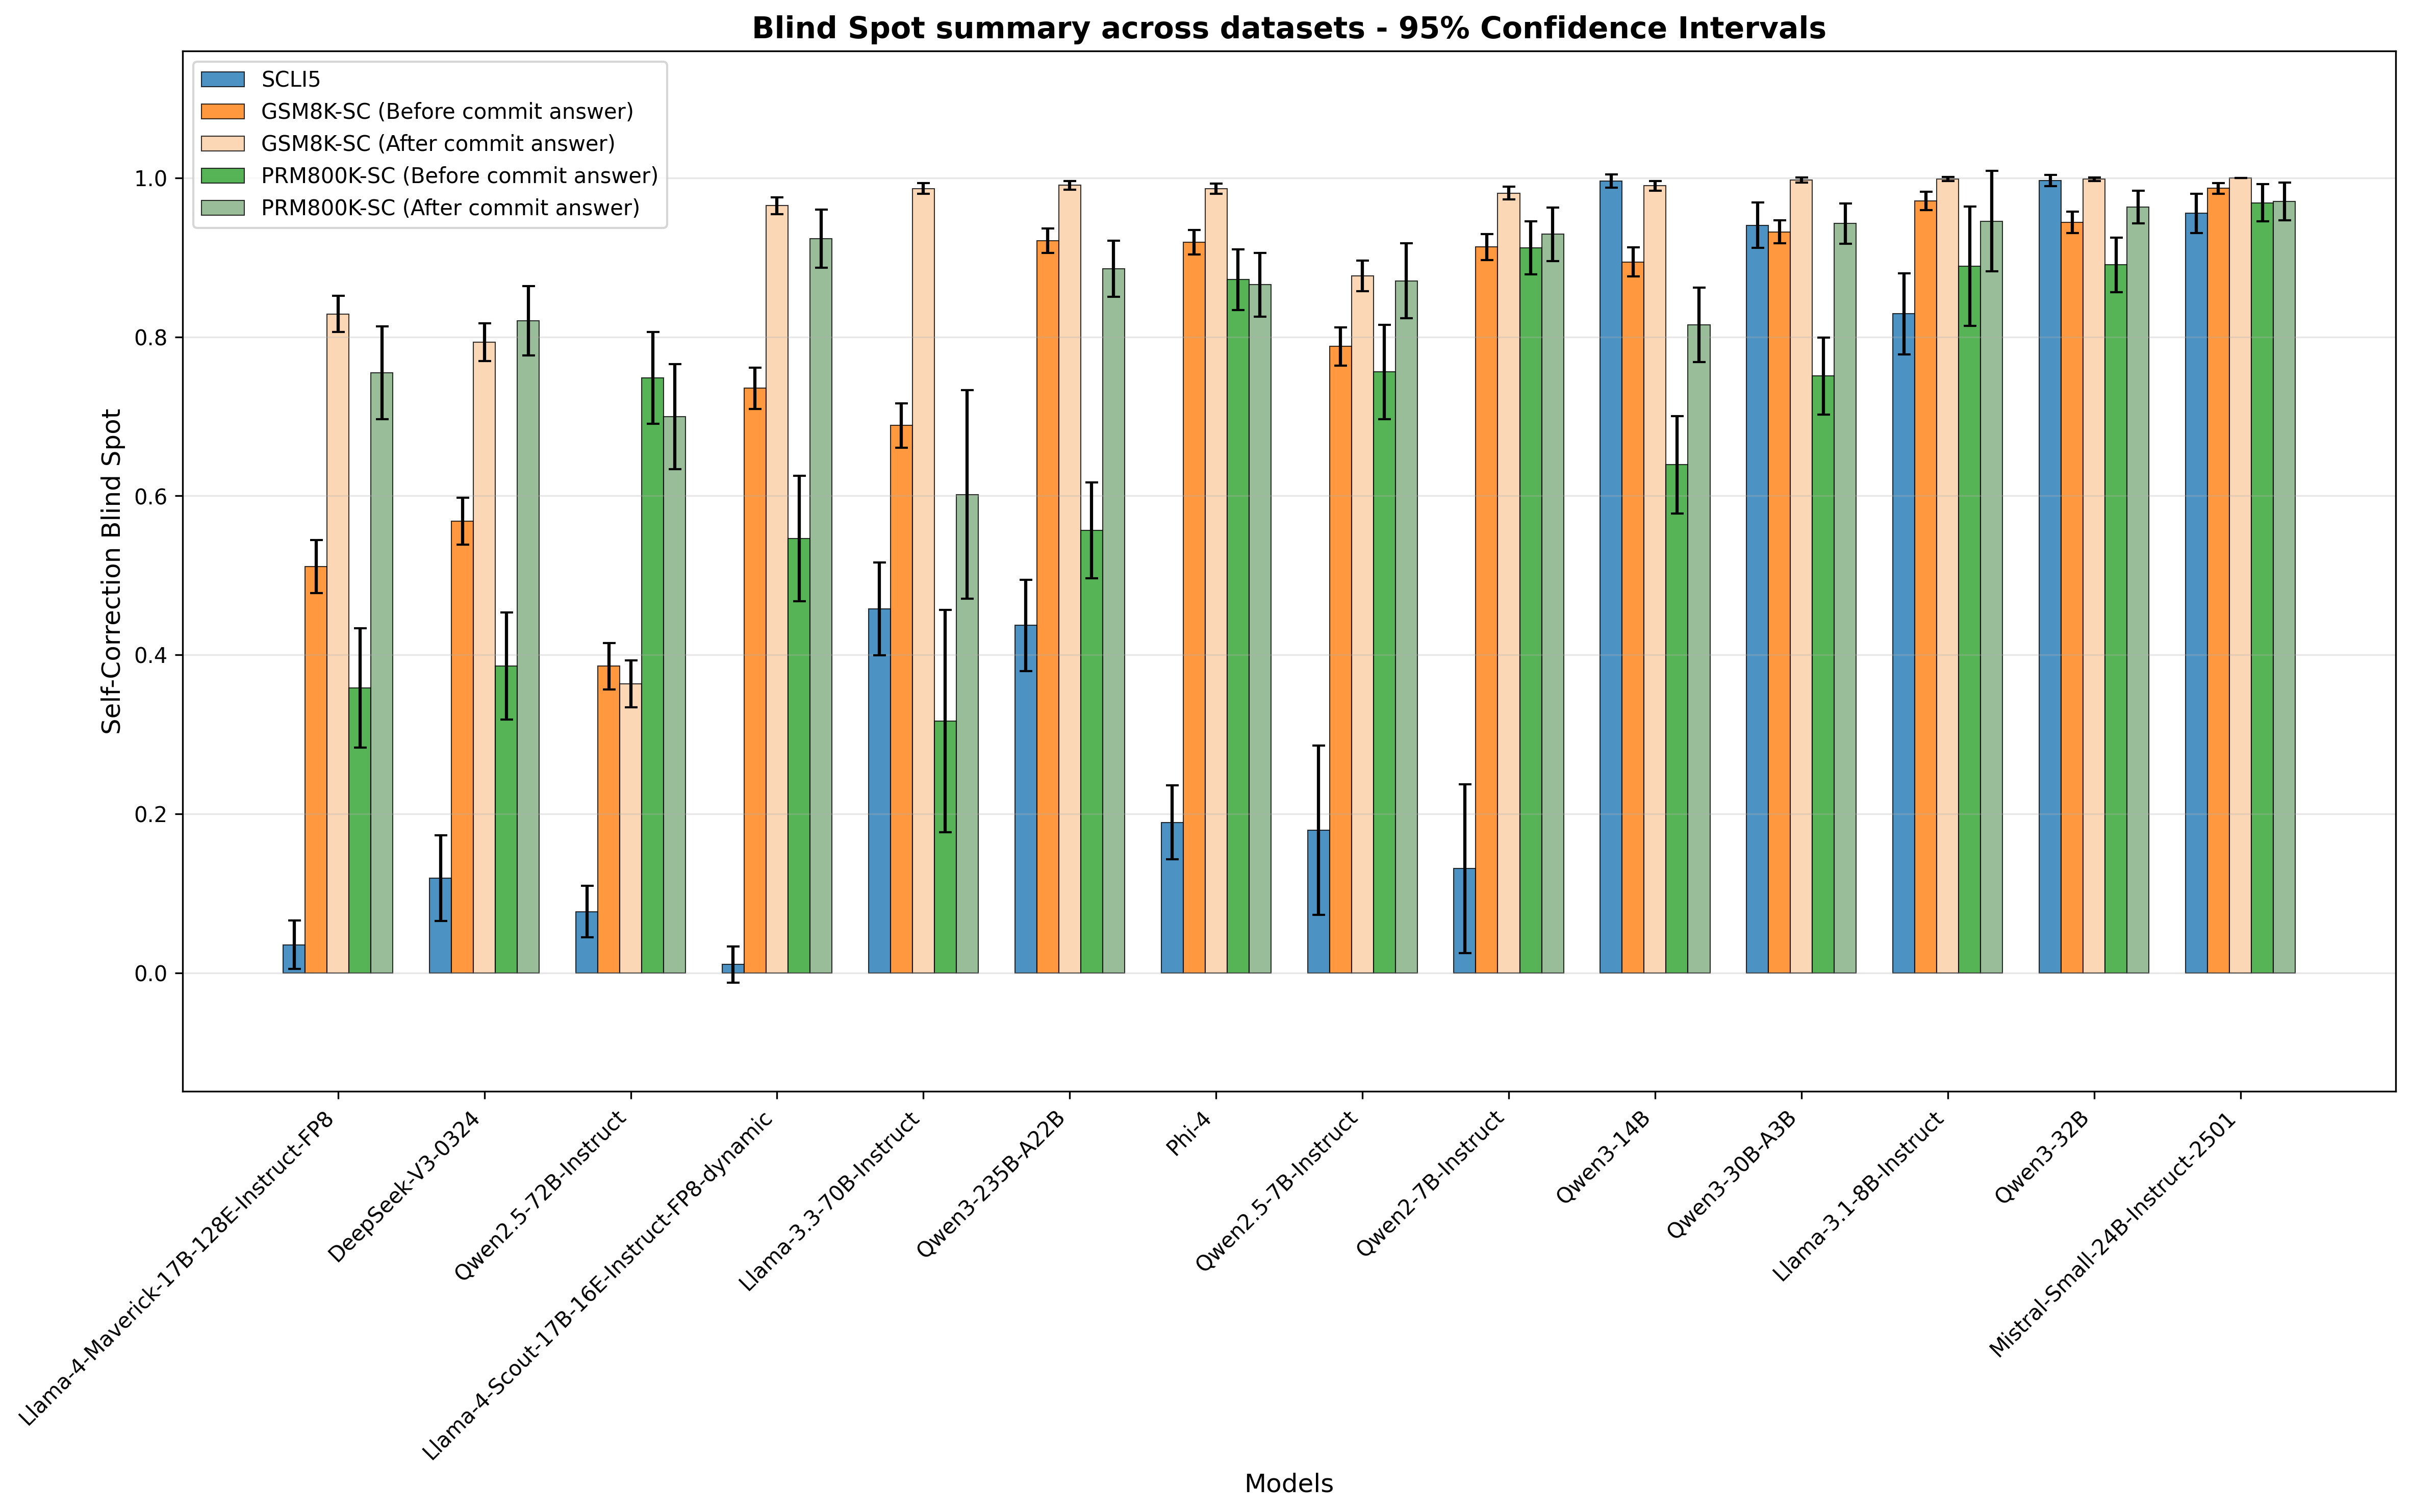
The image is a bar chart comparing the self-correction blind spot across different models. The chart displays the performance of various models using different datasets, with error bars indicating the 95% confidence intervals. The x-axis represents the models, and the y-axis represents the self-correction blind spot. The legend distinguishes between different datasets and whether the data is "before commit answer" or "after commit answer".
### Components/Axes
* **Title:** Blind Spot summary across datasets - 95% Confidence Intervals
* **X-axis:** Models (List of models is provided below)
* **Y-axis:** Self-Correction Blind Spot, scale from 0.0 to 1.0 in increments of 0.2.
* **Legend:** Located in the top-left corner.
* SCLI5 (Blue)
* GSM8K-SC (Before commit answer) (Orange)
* GSM8K-SC (After commit answer) (Light Orange)
* PRM800K-SC (Before commit answer) (Green)
* PRM800K-SC (After commit answer) (Light Green)
* **Models (X-Axis Labels):**
* Llama-4-Maverick-17B-128E-Instruct-FP8
* DeepSeek-V3-0324
* Qwen2.5-72B-Instruct
* Llama-4-Scout-17B-16E-Instruct-FP8-dynamic
* Llama-3.3-70B-Instruct
* Qwen3-235B-A22B
* Phi-4
* Qwen2.5-7B-Instruct
* Qwen2-7B-Instruct
* Qwen3-14B
* Qwen3-30B-A3B
* Llama-3.1-8B-Instruct
* Qwen3-32B
* Mistral-Small-24B-Instruct-2501
### Detailed Analysis
Here's a breakdown of the data for each model, noting the approximate values and trends:
**Llama-4-Maverick-17B-128E-Instruct-FP8:**
* SCLI5 (Blue): ~0.04
* GSM8K-SC (Before): ~0.52
* GSM8K-SC (After): ~0.65
* PRM800K-SC (Before): ~0.80
* PRM800K-SC (After): ~0.55
**DeepSeek-V3-0324:**
* SCLI5 (Blue): ~0.08
* GSM8K-SC (Before): ~0.58
* GSM8K-SC (After): ~0.82
* PRM800K-SC (Before): ~0.38
* PRM800K-SC (After): ~0.40
**Qwen2.5-72B-Instruct:**
* SCLI5 (Blue): ~0.78
* GSM8K-SC (Before): ~0.70
* GSM8K-SC (After): ~0.80
* PRM800K-SC (Before): ~0.70
* PRM800K-SC (After): ~0.70
**Llama-4-Scout-17B-16E-Instruct-FP8-dynamic:**
* SCLI5 (Blue): ~0.02
* GSM8K-SC (Before): ~0.75
* GSM8K-SC (After): ~0.90
* PRM800K-SC (Before): ~0.55
* PRM800K-SC (After): ~0.60
**Llama-3.3-70B-Instruct:**
* SCLI5 (Blue): ~0.35
* GSM8K-SC (Before): ~0.65
* GSM8K-SC (After): ~0.95
* PRM800K-SC (Before): ~0.90
* PRM800K-SC (After): ~0.90
**Qwen3-235B-A22B:**
* SCLI5 (Blue): ~0.45
* GSM8K-SC (Before): ~0.90
* GSM8K-SC (After): ~0.95
* PRM800K-SC (Before): ~0.55
* PRM800K-SC (After): ~0.60
**Phi-4:**
* SCLI5 (Blue): ~0.18
* GSM8K-SC (Before): ~0.85
* GSM8K-SC (After): ~0.20
* PRM800K-SC (Before): ~0.80
* PRM800K-SC (After): ~0.85
**Qwen2.5-7B-Instruct:**
* SCLI5 (Blue): ~0.15
* GSM8K-SC (Before): ~0.58
* GSM8K-SC (After): ~0.85
* PRM800K-SC (Before): ~0.20
* PRM800K-SC (After): ~0.85
**Qwen2-7B-Instruct:**
* SCLI5 (Blue): ~0.90
* GSM8K-SC (Before): ~0.90
* GSM8K-SC (After): ~0.95
* PRM800K-SC (Before): ~0.90
* PRM800K-SC (After): ~0.90
**Qwen3-14B:**
* SCLI5 (Blue): ~0.90
* GSM8K-SC (Before): ~0.85
* GSM8K-SC (After): ~0.95
* PRM800K-SC (Before): ~0.90
* PRM800K-SC (After): ~0.90
**Qwen3-30B-A3B:**
* SCLI5 (Blue): ~0.80
* GSM8K-SC (Before): ~0.95
* GSM8K-SC (After): ~0.95
* PRM800K-SC (Before): ~0.80
* PRM800K-SC (After): ~0.80
**Llama-3.1-8B-Instruct:**
* SCLI5 (Blue): ~0.85
* GSM8K-SC (Before): ~0.80
* GSM8K-SC (After): ~0.95
* PRM800K-SC (Before): ~0.90
* PRM800K-SC (After): ~0.90
**Qwen3-32B:**
* SCLI5 (Blue): ~0.90
* GSM8K-SC (Before): ~0.90
* GSM8K-SC (After): ~0.95
* PRM800K-SC (Before): ~0.90
* PRM800K-SC (After): ~0.90
**Mistral-Small-24B-Instruct-2501:**
* SCLI5 (Blue): ~0.90
* GSM8K-SC (Before): ~0.90
* GSM8K-SC (After): ~0.95
* PRM800K-SC (Before): ~0.90
* PRM800K-SC (After): ~0.90
### Key Observations
* The SCLI5 dataset (blue bars) generally shows lower self-correction blind spots compared to the other datasets for most models, except for the last few models where it is comparable.
* GSM8K-SC (Before commit answer) and GSM8K-SC (After commit answer) datasets (orange and light orange bars) often show high self-correction blind spots.
* The error bars indicate the variability in the results, with some models showing wider confidence intervals than others.
* For some models, there is a noticeable difference between the "before commit answer" and "after commit answer" results, suggesting that the commit status affects the self-correction blind spot.
### Interpretation
The bar chart provides a comparative analysis of the self-correction blind spot across different models and datasets. The data suggests that the choice of model and dataset significantly impacts the self-correction blind spot. The 95% confidence intervals provide a measure of the reliability of the results. The differences between "before commit answer" and "after commit answer" results highlight the importance of considering the commit status when evaluating model performance. The chart allows for identifying models that perform well across different datasets and those that are more sensitive to the choice of dataset.