## [Bar Chart]: Blind Spot summary across datasets - 95% Confidence Intervals
### Overview
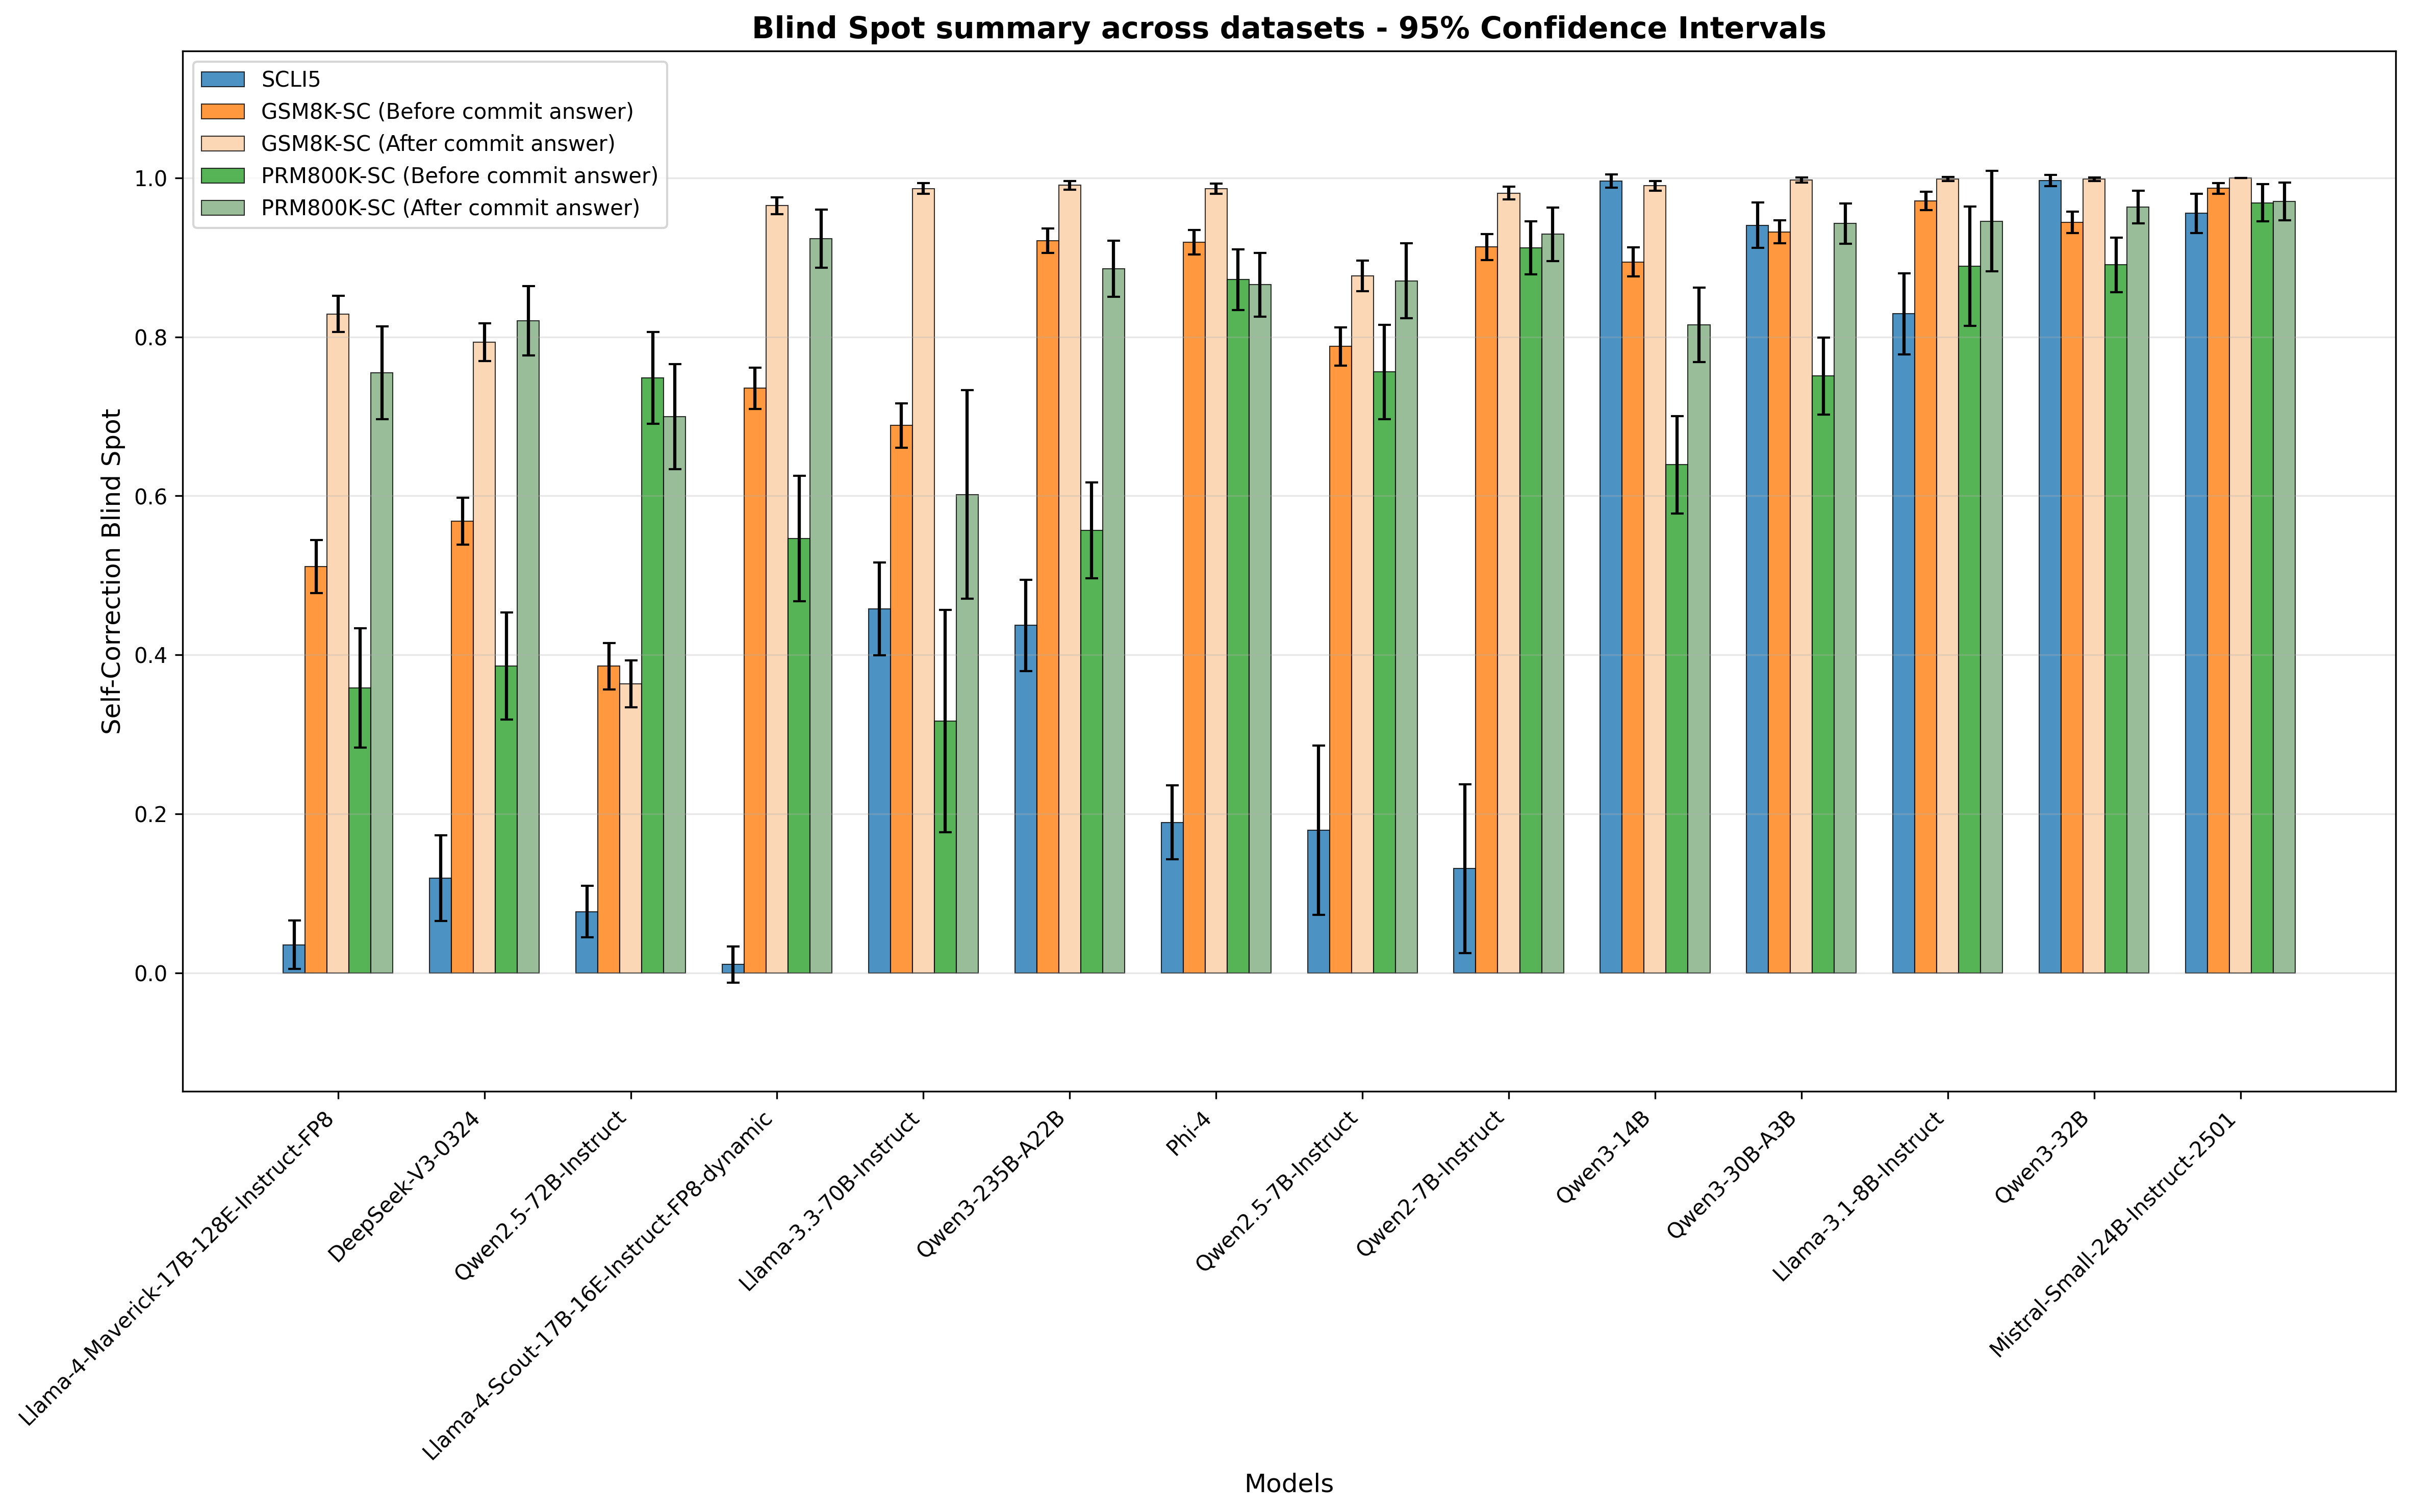
The image is a bar chart displaying **"Self-Correction Blind Spot"** values (y-axis) across 14 AI models (x-axis) for five datasets. Each bar includes a 95% confidence interval (error bar) to show variability. The chart evaluates how models perform in self-correction across different datasets, with "Before commit answer" and "After commit answer" variants for two datasets (GSM8K-SC, PRM800K-SC) and a single variant for SCL15.
### Components/Axes
- **Title**: *"Blind Spot summary across datasets - 95% Confidence Intervals"*
- **Y-axis**: Label = *"Self-Correction Blind Spot"*; Scale = 0.0 to 1.0 (increments of 0.2).
- **X-axis**: Label = *"Models"*; 14 model names (listed below).
- **Legend** (top-left):
- SCL15 (blue)
- GSM8K-SC (Before commit answer) (orange)
- GSM8K-SC (After commit answer) (light orange)
- PRM800K-SC (Before commit answer) (green)
- PRM800K-SC (After commit answer) (light green)
### Detailed Analysis (Data Points)
Approximate values (mean ± 95% CI) for each model and dataset:
| Model Name | SCL15 (blue) | GSM8K-SC (Before) | GSM8K-SC (After) | PRM800K-SC (Before) | PRM800K-SC (After) |
| :--- | :--- | :--- | :--- | :--- | :--- |
| Llama-4-Maverick-17B-128E-Instruct-FP8 | ~0.03 (0.01–0.05) | ~0.51 (0.48–0.54) | ~0.83 (0.80–0.86) | ~0.36 (0.33–0.39) | ~0.76 (0.73–0.79) |
| DeepSeek-V3-0324 | ~0.12 (0.09–0.15) | ~0.57 (0.54–0.60) | ~0.79 (0.76–0.82) | ~0.39 (0.36–0.42) | ~0.82 (0.79–0.85) |
| Qwen2.5-72B-Instruct | ~0.08 (0.05–0.11) | ~0.39 (0.36–0.42) | ~0.37 (0.34–0.40) | ~0.75 (0.72–0.78) | ~0.70 (0.67–0.73) |
| Llama-4-Scout-17B-16E-Instruct-FP8-dynamic | ~0.01 (0.00–0.02) | ~0.73 (0.70–0.76) | ~0.96 (0.93–0.99) | ~0.55 (0.52–0.58) | ~0.92 (0.89–0.95) |
| Llama-3.3-70B-Instruct | ~0.46 (0.43–0.49) | ~0.69 (0.66–0.72) | ~0.99 (0.96–1.02) | ~0.32 (0.29–0.35) | ~0.60 (0.57–0.63) |
| Qwen3-235B-A22B | ~0.44 (0.41–0.47) | ~0.92 (0.89–0.95) | ~0.99 (0.96–1.02) | ~0.56 (0.53–0.59) | ~0.88 (0.85–0.91) |
| Phi-4 | ~0.19 (0.16–0.22) | ~0.92 (0.89–0.95) | ~0.99 (0.96–1.02) | ~0.87 (0.84–0.90) | ~0.86 (0.83–0.89) |
| Qwen2.5-7B-Instruct | ~0.18 (0.15–0.21) | ~0.79 (0.76–0.82) | ~0.87 (0.84–0.90) | ~0.76 (0.73–0.79) | ~0.87 (0.84–0.90) |
| Qwen2-7B-Instruct | ~0.13 (0.10–0.16) | ~0.91 (0.88–0.94) | ~0.98 (0.95–1.01) | ~0.91 (0.88–0.94) | ~0.93 (0.90–0.96) |
| Qwen3-14B | ~1.00 (0.97–1.03) | ~0.89 (0.86–0.92) | ~0.99 (0.96–1.02) | ~0.64 (0.61–0.67) | ~0.81 (0.78–0.84) |
| Qwen3-30B-A3B | ~0.94 (0.91–0.97) | ~0.93 (0.90–0.96) | ~1.00 (0.97–1.03) | ~0.75 (0.72–0.78) | ~0.94 (0.91–0.97) |
| Llama-3.1-8B-Instruct | ~0.83 (0.80–0.86) | ~0.97 (0.94–1.00) | ~1.00 (0.97–1.03) | ~0.89 (0.86–0.92) | ~0.94 (0.91–0.97) |
| Qwen3-32B | ~1.00 (0.97–1.03) | ~0.94 (0.91–0.97) | ~1.00 (0.97–1.03) | ~0.89 (0.86–0.92) | ~0.96 (0.93–0.99) |
| Mistral-Small-24B-Instruct-2501 | ~0.96 (0.93–0.99) | ~0.99 (0.96–1.02) | ~1.00 (0.97–1.03) | ~0.96 (0.93–0.99) | ~0.97 (0.94–1.00) |
### Key Observations
1. **SCL15 (blue)**: Most models have low values (≤0.46), except Qwen3-14B, Qwen3-30B-A3B, Llama-3.1-8B-Instruct, Qwen3-32B, and Mistral-Small-24B-Instruct-2501 (≥0.83).
2. **GSM8K-SC (Before/After)**: "After commit answer" (light orange) consistently outperforms "Before" (orange) for most models, indicating improved self-correction after finalizing answers.
3. **PRM800K-SC (Before/After)**: "After commit answer" (light green) often exceeds "Before" (green), mirroring GSM8K-SC’s trend.
4. **Error Bars**: Narrow intervals (e.g., Qwen3-235B-A22B) suggest consistent results; wider intervals (e.g., Llama-4-Scout-17B-16E-Instruct-FP8-dynamic for PRM800K-SC Before) indicate variability.
5. **Model Performance**: Larger models (e.g., Qwen3-235B-A22B, Llama-3.3-70B-Instruct) and smaller models (e.g., Qwen3-14B, Mistral-Small) show high blind spot values, especially post-commit.
### Interpretation
The chart measures **self-correction blind spots** (how well models correct errors) across datasets. Key insights:
- **Dataset Impact**: GSM8K-SC and PRM800K-SC show improved performance after committing answers, suggesting finalizing responses enhances self-correction.
- **Model Architecture**: Larger models (e.g., Qwen3-235B) and smaller models (e.g., Qwen3-14B) perform well, indicating architecture/training (not just size) drives self-correction.
- **SCL15 Anomaly**: SCL15 has low values for most models, suggesting it measures a distinct (or more challenging) aspect of self-correction.
This data guides model development by identifying which models/datasets excel at self-correction, informing future evaluations and improvements.