## Line Chart: Accuracy vs. Attack Ratio for Different Federated Learning Algorithms
### Overview
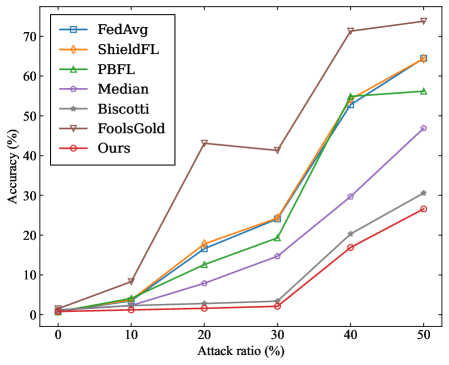
The image is a line chart comparing the accuracy of different federated learning algorithms as the attack ratio increases. The x-axis represents the attack ratio (%), and the y-axis represents the accuracy (%). Several algorithms are compared, including FedAvg, ShieldFL, PBFL, Median, Biscotti, FoolsGold, and "Ours".
### Components/Axes
* **X-axis:** Attack ratio (%), with markers at 0, 10, 20, 30, 40, and 50.
* **Y-axis:** Accuracy (%), with markers at 0, 10, 20, 30, 40, 50, 60, and 70.
* **Legend:** Located in the top-left corner, associating each algorithm with a specific color and marker.
* FedAvg (blue, square marker)
* ShieldFL (orange, diamond marker)
* PBFL (green, triangle marker)
* Median (purple, circle marker)
* Biscotti (gray, star marker)
* FoolsGold (brown, inverted triangle marker)
* Ours (red, circle marker)
### Detailed Analysis
* **FedAvg (blue squares):** Starts at approximately 1% accuracy at 0% attack ratio. The accuracy increases steadily to approximately 54% at 40% attack ratio, and then increases to approximately 64% at 50% attack ratio.
* **ShieldFL (orange diamonds):** Starts at approximately 1% accuracy at 0% attack ratio. The accuracy increases steadily to approximately 54% at 40% attack ratio, and then increases to approximately 66% at 50% attack ratio.
* **PBFL (green triangles):** Starts at approximately 1% accuracy at 0% attack ratio. The accuracy increases steadily to approximately 54% at 40% attack ratio, and then increases to approximately 64% at 50% attack ratio.
* **Median (purple circles):** Starts at approximately 1% accuracy at 0% attack ratio. The accuracy increases steadily to approximately 23% at 50% attack ratio.
* **Biscotti (gray stars):** Starts at approximately 1% accuracy at 0% attack ratio. The accuracy increases steadily to approximately 30% at 50% attack ratio.
* **FoolsGold (brown inverted triangles):** Starts at approximately 1% accuracy at 0% attack ratio. The accuracy increases sharply to approximately 43% at 20% attack ratio, then decreases slightly to approximately 41% at 30% attack ratio, and then increases sharply to approximately 72% at 40% attack ratio, and then increases slightly to approximately 74% at 50% attack ratio.
* **Ours (red circles):** Starts at approximately 1% accuracy at 0% attack ratio. The accuracy increases steadily to approximately 27% at 50% attack ratio.
### Key Observations
* FoolsGold has the highest accuracy at higher attack ratios (40% and 50%), but also exhibits a peculiar drop in accuracy at 30% attack ratio.
* FedAvg, ShieldFL, and PBFL perform similarly, with ShieldFL having a slightly higher accuracy at 50% attack ratio.
* Median, Biscotti, and "Ours" have significantly lower accuracy compared to the other algorithms, especially at higher attack ratios.
* All algorithms start with approximately the same accuracy at 0% attack ratio.
### Interpretation
The chart demonstrates the impact of increasing attack ratios on the accuracy of different federated learning algorithms. FoolsGold appears to be the most resilient to attacks at higher attack ratios, despite a dip in performance at 30% attack ratio. FedAvg, ShieldFL, and PBFL show similar performance, indicating a comparable level of robustness. Median, Biscotti, and "Ours" are more susceptible to attacks, resulting in lower accuracy as the attack ratio increases. The initial similar accuracy at 0% attack ratio suggests that the algorithms perform comparably in the absence of attacks, and the differences in performance emerge as the attack ratio increases. The "Ours" algorithm performs the worst in this comparison.