## Line Graph: Accuracy vs. Attack Ratio (%)
### Overview
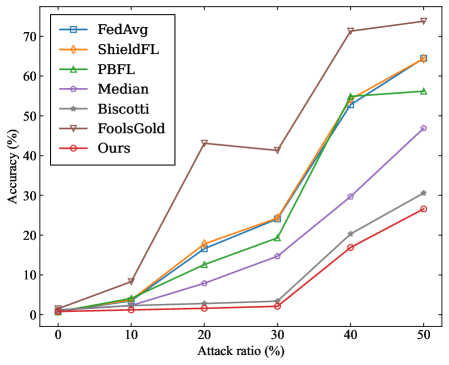
The image is a line graph comparing the accuracy of seven different methods (FedAvg, ShieldFL, PBFL, Median, Biscotti, FoolsGold, and Ours) across varying attack ratios (0% to 50%). Accuracy is measured on the y-axis (0–70%), while the x-axis represents attack ratio percentages. The graph highlights how each method's performance degrades or improves as the attack ratio increases.
### Components/Axes
- **X-axis**: "Attack ratio (%)" with ticks at 0, 10, 20, 30, 40, 50.
- **Y-axis**: "Accuracy (%)" with ticks at 0, 10, 20, 30, 40, 50, 60, 70.
- **Legend**: Positioned on the left side of the graph, with colored markers and labels for each method:
- **FedAvg**: Blue squares (□)
- **ShieldFL**: Orange diamonds (◇)
- **PBFL**: Green triangles (△)
- **Median**: Purple diamonds (◇)
- **Biscotti**: Gray stars (★)
- **FoolsGold**: Brown triangles (△)
- **Ours**: Red circles (●)
### Detailed Analysis
1. **FedAvg (Blue Squares)**:
- Starts at ~0% accuracy at 0% attack ratio.
- Gradually increases, reaching ~55% at 50% attack ratio.
- Shows steady upward trend with minimal fluctuations.
2. **ShieldFL (Orange Diamonds)**:
- Begins at ~0% accuracy at 0% attack ratio.
- Sharp rise after 30% attack ratio, surpassing FedAvg by ~60% at 50%.
- Peaks at ~65% accuracy at 50% attack ratio.
3. **PBFL (Green Triangles)**:
- Starts at ~0% accuracy at 0% attack ratio.
- Gradual increase, reaching ~55% at 50% attack ratio.
- Slight dip at 30% attack ratio (~20% accuracy) before recovering.
4. **Median (Purple Diamonds)**:
- Starts at ~0% accuracy at 0% attack ratio.
- Slow, linear increase, reaching ~45% at 50% attack ratio.
- Minimal fluctuations throughout.
5. **Biscotti (Gray Stars)**:
- Starts at ~0% accuracy at 0% attack ratio.
- Gradual increase, reaching ~30% at 50% attack ratio.
- Slight dip at 30% attack ratio (~10% accuracy).
6. **FoolsGold (Brown Triangles)**:
- Starts at ~0% accuracy at 0% attack ratio.
- Sharp spike to ~70% accuracy at 30% attack ratio.
- Plateaus at ~70% until 40% attack ratio, then drops to ~60% at 50% attack ratio.
7. **Ours (Red Circles)**:
- Starts at ~0% accuracy at 0% attack ratio.
- Flat until 30% attack ratio (~2% accuracy).
- Sharp rise to ~25% accuracy at 50% attack ratio.
### Key Observations
- **FoolsGold** exhibits the highest accuracy at 30% attack ratio (~70%) but drops significantly at 50% (~60%), suggesting vulnerability to higher attacks.
- **ShieldFL** and **FedAvg** show robust performance, with ShieldFL outperforming FedAvg at higher attack ratios.
- **PBFL** and **Ours** demonstrate significant improvements at higher attack ratios, indicating resilience.
- **Median** and **Biscotti** lag behind other methods, with minimal accuracy gains even at 50% attack ratio.
### Interpretation
The graph illustrates that methods like **ShieldFL** and **FoolsGold** excel in high-attack scenarios, though FoolsGold's sharp decline at 50% raises concerns about stability. **FedAvg** and **PBFL** provide consistent performance, while **Ours** shows promise with a late-stage surge. The data suggests that methods prioritizing adaptive defense mechanisms (e.g., ShieldFL) may be more effective under sustained attacks. The inclusion of "Ours" as a distinct method implies a novel approach, potentially offering a balance between robustness and efficiency. The graph underscores the importance of evaluating methods across varying attack intensities to identify optimal solutions for real-world applications.