## Neural Network Architecture Diagram
### Overview
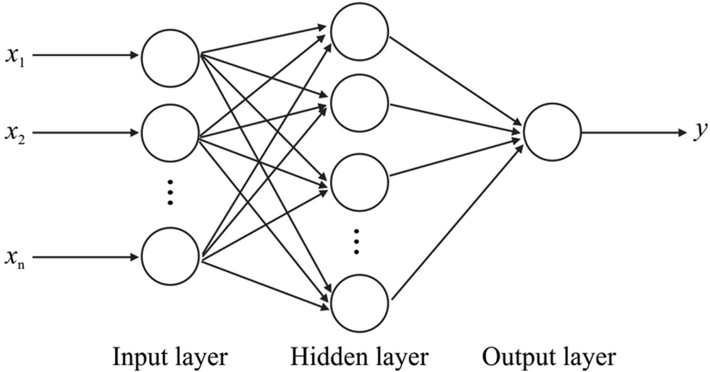
The image depicts a simplified schematic of a neural network with three distinct layers: an input layer, a hidden layer, and an output layer. Nodes within each layer are interconnected, illustrating the flow of information from input to output.
### Components/Axes
- **Input Layer**: Contains nodes labeled $ x_1, x_2, \dots, x_n $, representing input features.
- **Hidden Layer**: Composed of unlabeled nodes (circles) with dense interconnections between input and output nodes.
- **Output Layer**: A single node labeled $ y $, representing the network's output.
- **Connections**: Arrows indicate directional data flow between layers. No explicit weights or activation functions are labeled.
### Detailed Analysis
- **Input Layer**: Nodes $ x_1 $ to $ x_n $ are spatially aligned horizontally, with $ x_1 $ on the far left and $ x_n $ on the far right.
- **Hidden Layer**: Nodes are centrally positioned, with bidirectional connections to both input and output layers. The number of hidden nodes is unspecified (denoted by ellipses).
- **Output Layer**: A single node $ y $ is located on the far right, receiving aggregated input from the hidden layer.
### Key Observations
- The diagram emphasizes the layered structure of neural networks, with no explicit numerical values or activation functions provided.
- All connections between layers are unidirectional (input → hidden → output), though bidirectional arrows between hidden layer nodes suggest internal connectivity.
- No legends, color coding, or numerical annotations are present.
### Interpretation
This diagram abstractly represents the fundamental architecture of a feedforward neural network. The absence of labeled weights or activation functions suggests a focus on structural relationships rather than computational details. The dense interconnections in the hidden layer imply a fully connected (dense) layer, typical in many neural network designs. The single output node $ y $ indicates a regression or binary classification task, depending on context not provided in the image. The simplicity of the diagram prioritizes conceptual clarity over implementation specifics.