## Line Charts: Vision and Text Model Performance
### Overview
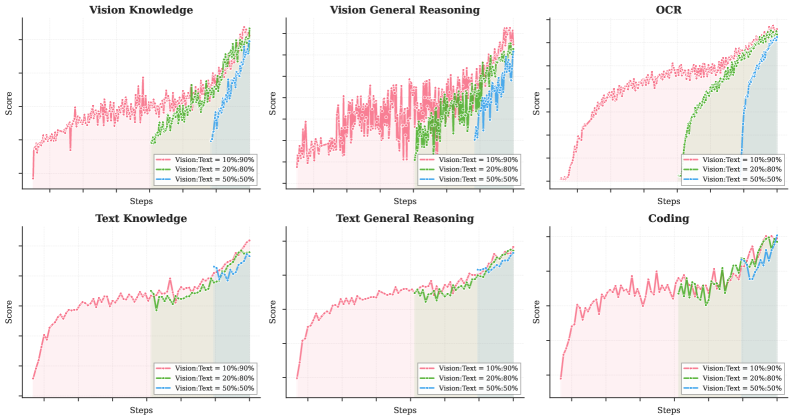
The image presents six line charts arranged in a 2x3 grid, comparing the performance of models trained with varying ratios of vision and text data across different tasks. Each chart displays the score achieved over a number of steps for three different vision/text data ratios: 10%:90%, 20%:80%, and 50%:50%. The tasks evaluated are Vision Knowledge, Vision General Reasoning, OCR, Text Knowledge, Text General Reasoning, and Coding.
### Components/Axes
Each chart has the following components:
* **Title:** Located at the top of each chart, indicating the specific task being evaluated (e.g., "Vision Knowledge").
* **X-axis:** Labeled "Steps," representing the training steps. The scale is not explicitly marked with numerical values.
* **Y-axis:** Labeled "Score," representing the performance score. The scale is not explicitly marked with numerical values.
* **Data Series:** Three lines representing different vision/text data ratios:
* Pink: Vision/Text = 10%:90%
* Green: Vision/Text = 20%:80%
* Blue: Vision/Text = 50%:50%
* **Legend:** Located in the bottom-right corner of each chart, explaining the color-coding for the different vision/text ratios.
### Detailed Analysis
**1. Vision Knowledge**
* **Pink (10%:90%):** The score fluctuates significantly in the early steps, then gradually increases.
* **Green (20%:80%):** The score starts to increase later than the pink line, but eventually catches up.
* **Blue (50%:50%):** The score increases more sharply towards the end of the steps.
* The pink line starts at a score of approximately 20, the green line starts at a score of approximately 40, and the blue line starts at a score of approximately 60.
**2. Vision General Reasoning**
* **Pink (10%:90%):** The score fluctuates significantly in the early steps, then gradually increases.
* **Green (20%:80%):** The score starts to increase later than the pink line, but eventually catches up.
* **Blue (50%:50%):** The score increases more sharply towards the end of the steps.
* The pink line starts at a score of approximately 20, the green line starts at a score of approximately 40, and the blue line starts at a score of approximately 60.
**3. OCR**
* **Pink (10%:90%):** The score increases rapidly in the early steps, then plateaus.
* **Green (20%:80%):** The score increases more gradually than the pink line.
* **Blue (50%:50%):** The score increases more sharply towards the end of the steps.
* The pink line starts at a score of approximately 20, the green line starts at a score of approximately 40, and the blue line starts at a score of approximately 60.
**4. Text Knowledge**
* **Pink (10%:90%):** The score fluctuates significantly in the early steps, then gradually increases.
* **Green (20%:80%):** The score starts to increase later than the pink line, but eventually catches up.
* **Blue (50%:50%):** The score increases more sharply towards the end of the steps.
* The pink line starts at a score of approximately 20, the green line starts at a score of approximately 40, and the blue line starts at a score of approximately 60.
**5. Text General Reasoning**
* **Pink (10%:90%):** The score fluctuates significantly in the early steps, then gradually increases.
* **Green (20%:80%):** The score starts to increase later than the pink line, but eventually catches up.
* **Blue (50%:50%):** The score increases more sharply towards the end of the steps.
* The pink line starts at a score of approximately 20, the green line starts at a score of approximately 40, and the blue line starts at a score of approximately 60.
**6. Coding**
* **Pink (10%:90%):** The score fluctuates significantly in the early steps, then gradually increases.
* **Green (20%:80%):** The score starts to increase later than the pink line, but eventually catches up.
* **Blue (50%:50%):** The score increases more sharply towards the end of the steps.
* The pink line starts at a score of approximately 20, the green line starts at a score of approximately 40, and the blue line starts at a score of approximately 60.
### Key Observations
* For most tasks, the model trained with a 10%:90% vision/text ratio (pink line) initially performs well but plateaus or is overtaken by the other models.
* The model trained with a 50%:50% vision/text ratio (blue line) often shows a stronger increase in performance towards the end of the training steps.
* The model trained with a 20%:80% vision/text ratio (green line) generally shows a more gradual increase in performance.
* The OCR task shows a distinct pattern where the 10%:90% ratio performs best initially, but the 50%:50% ratio eventually catches up.
* The "Steps" and "Score" axes lack numerical scales, making it difficult to determine the exact performance values.
### Interpretation
The charts suggest that the optimal vision/text data ratio for training models depends on the specific task. For tasks like OCR, a higher proportion of text data (10%:90%) may be beneficial initially, but a balanced ratio (50%:50%) can lead to better long-term performance. The fluctuating performance of the 10%:90% ratio in the early steps of most tasks suggests that models trained with a high proportion of text data may be more sensitive to noise or require more careful tuning. The consistent improvement of the 50%:50% ratio towards the end of the training steps indicates that a balanced dataset can lead to more robust and generalizable models. The lack of numerical scales on the axes limits the ability to draw precise conclusions about the performance differences between the models.