## Chart: Performance Comparison Across Tasks
### Overview
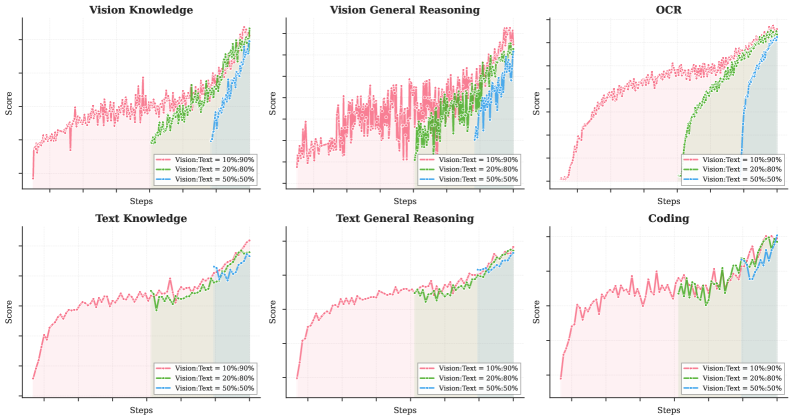
The image presents a 2x3 grid of line charts, each depicting the performance "Score" against the number of "Steps" taken during training or evaluation. Each chart compares three data series representing different ratios of Vision to Text data (10%/90%, 20%/80%, and 50%/50%). The charts cover six different tasks: Vision Knowledge, Vision General Reasoning, OCR, Text Knowledge, Text General Reasoning, and Coding.
### Components/Axes
* **X-axis:** "Steps" - Represents the progression of training or evaluation. The scale is not explicitly labeled, but appears to range from approximately 0 to 1000.
* **Y-axis:** "Score" - Represents the performance metric. The scale ranges from approximately 0 to 1.0.
* **Legend:** Located at the bottom-right of each chart.
* "Vision:Text - 10%/90%" (represented by a red line with triangle markers)
* "Vision:Text - 20%/80%" (represented by a green line with circle markers)
* "Vision:Text - 50%/50%" (represented by a blue line with square markers)
* **Titles:** Each chart has a title indicating the task being evaluated: "Vision Knowledge", "Vision General Reasoning", "OCR", "Text Knowledge", "Text General Reasoning", and "Coding".
* **Grey Shaded Area:** A grey shaded area is present in each chart, spanning a portion of the x-axis. The purpose of this shading is not explicitly stated.
### Detailed Analysis or Content Details
**1. Vision Knowledge:**
* The blue line (50%/50%) shows a generally upward trend, starting around 0.2 and reaching approximately 0.8.
* The green line (20%/80%) starts around 0.2 and plateaus around 0.4.
* The red line (10%/90%) fluctuates around 0.3 with minimal improvement.
**2. Vision General Reasoning:**
* The blue line (50%/50%) shows a strong upward trend, starting near 0 and reaching approximately 0.9.
* The green line (20%/80%) shows a moderate upward trend, starting near 0 and reaching approximately 0.6.
* The red line (10%/90%) remains relatively flat, fluctuating around 0.2.
**3. OCR:**
* The blue line (50%/50%) shows a rapid increase initially, reaching approximately 0.9, then plateaus.
* The green line (20%/80%) shows a similar trend, but starts lower and reaches approximately 0.7.
* The red line (10%/90%) shows a slow increase, reaching approximately 0.5.
**4. Text Knowledge:**
* The blue line (50%/50%) shows a steady upward trend, starting around 0.3 and reaching approximately 0.8.
* The green line (20%/80%) shows a similar trend, starting around 0.2 and reaching approximately 0.6.
* The red line (10%/90%) fluctuates around 0.3 with minimal improvement.
**5. Text General Reasoning:**
* The blue line (50%/50%) shows a very strong upward trend, starting near 0 and reaching approximately 1.0.
* The green line (20%/80%) shows a moderate upward trend, starting near 0 and reaching approximately 0.7.
* The red line (10%/90%) remains relatively flat, fluctuating around 0.2.
**6. Coding:**
* The blue line (50%/50%) shows a fluctuating trend, starting around 0.3 and reaching approximately 0.7.
* The green line (20%/80%) shows a similar fluctuating trend, starting around 0.2 and reaching approximately 0.6.
* The red line (10%/90%) shows a fluctuating trend, starting around 0.2 and reaching approximately 0.4.
### Key Observations
* The 50%/50% Vision/Text ratio consistently outperforms the other ratios across all tasks.
* The 10%/90% Vision/Text ratio generally performs the worst, showing minimal improvement over the course of the steps.
* The grey shaded area appears to coincide with a period of rapid learning or change in performance for most tasks.
* The "Text General Reasoning" task shows the most significant performance improvement for the 50%/50% ratio, reaching a score of approximately 1.0.
* The "Vision General Reasoning" task also shows a strong performance improvement for the 50%/50% ratio.
### Interpretation
The data suggests that a balanced combination of Vision and Text data (50%/50%) leads to the best performance across a variety of tasks, including Vision Knowledge, Vision General Reasoning, OCR, Text Knowledge, Text General Reasoning, and Coding. The tasks involving "General Reasoning" (both Vision and Text) show the most dramatic improvements with the balanced data ratio, indicating that the model benefits from exposure to both modalities for complex reasoning tasks. The consistently poor performance of the 10%/90% ratio suggests that relying heavily on one modality (either Vision or Text) hinders the model's ability to learn and generalize. The grey shaded areas likely represent critical phases of learning where the model is making significant adjustments to its parameters. The OCR task shows a high ceiling, with the 50/50 ratio reaching near-perfect performance relatively quickly. The Coding task shows the least dramatic improvement, suggesting it may be a more challenging task or require a different training approach. The charts provide a comparative analysis of different data mixing strategies and their impact on model performance, offering insights into optimal training configurations for multimodal models.