## Chart Type: Multi-line Graphs with Confidence Intervals
### Overview
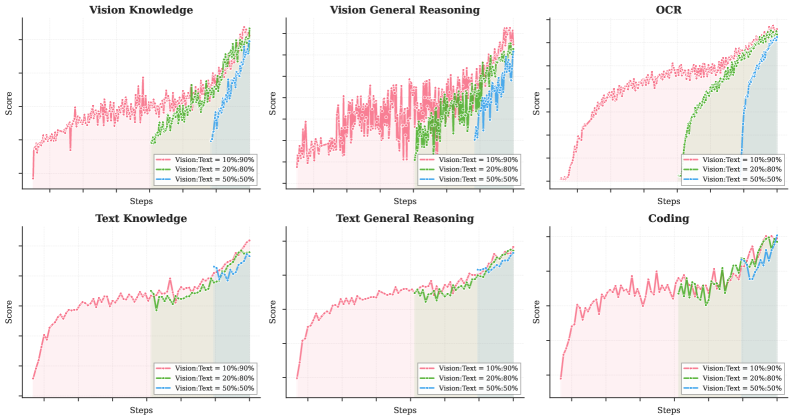
The image contains six side-by-side line graphs comparing performance scores across different "Vision-Text" configuration percentages (10%-90%, 20%-80%, 50%-50%) over training steps. Each graph represents a distinct task category (Vision Knowledge, Vision General Reasoning, OCR, Text Knowledge, Text General Reasoning, Coding). Scores increase with steps, with shaded regions indicating confidence intervals.
### Components/Axes
- **X-axis**: "Steps" (training iterations), ranging from 0 to ~100.
- **Y-axis**: "Score" (performance metric), normalized between 0 and 1.
- **Legends**: Positioned in the bottom-left corner of each graph, mapping colors to configurations:
- Red: Vision-Text = 10%-90%
- Green: Vision-Text = 20%-80%
- Blue: Vision-Text = 50%-50%
- **Shaded Regions**: Gray areas under each line represent 95% confidence intervals.
### Detailed Analysis
1. **Vision Knowledge**
- **Trend**: All lines slope upward. The blue (50%-50%) line rises steepest, reaching ~0.95 at 100 steps. Green (20%-80%) plateaus near ~0.85, while red (10%-90%) peaks at ~0.75.
- **Confidence Intervals**: Red line has the widest shaded area, indicating higher variability.
2. **Vision General Reasoning**
- **Trend**: Blue line dominates, reaching ~0.9 at 100 steps. Green (~0.8) and red (~0.7) lag behind.
- **Confidence Intervals**: Red line shows erratic fluctuations, with a narrower shaded region at later steps.
3. **OCR**
- **Trend**: Blue line ascends sharply to ~0.95. Green (~0.85) and red (~0.7) follow.
- **Confidence Intervals**: Shaded regions narrow for all lines as steps increase, suggesting stabilizing performance.
4. **Text Knowledge**
- **Trend**: Blue line reaches ~0.9, green (~0.8), and red (~0.7) at 100 steps.
- **Confidence Intervals**: Red line’s shaded area is consistently wider, reflecting instability.
5. **Text General Reasoning**
- **Trend**: Blue line peaks at ~0.9, green (~0.8), and red (~0.75) at 100 steps.
- **Confidence Intervals**: Green line’s shaded region narrows significantly after 50 steps.
6. **Coding**
- **Trend**: Blue line climbs to ~0.95, green (~0.85), and red (~0.75) at 100 steps.
- **Confidence Intervals**: Red line’s shaded area is the widest, with abrupt dips at ~20 and ~60 steps.
### Key Observations
- **Performance Correlation**: The 50%-50% configuration (blue) consistently outperforms skewed configurations (red/green) across all tasks.
- **Variability**: Lower Vision-Text percentages (10%-90%) exhibit wider confidence intervals, indicating less reliable performance.
- **Task-Specific Trends**: OCR and Coding show the most pronounced gains with balanced configurations, while Vision General Reasoning has the least separation between lines.
### Interpretation
The data suggests that balanced Vision-Text configurations (50%-50%) optimize performance by equally leveraging both modalities. Skewed configurations (e.g., 10%-90%) likely underutilize one modality or over-rely on the other, leading to instability (wider confidence intervals). The narrowing shaded regions in later steps imply that models stabilize as training progresses, but initial variability highlights the importance of configuration choice. OCR and Coding tasks benefit most from balance, possibly due to their reliance on multimodal integration.