## 3D Surface Plot: Free Energy vs. θ1 and θ2
### Overview
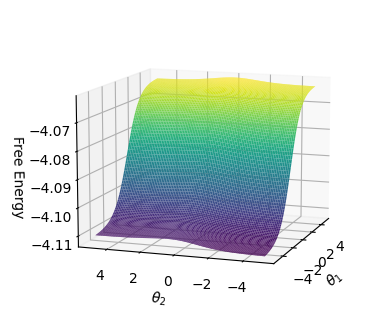
The image is a 3D surface plot visualizing the relationship between Free Energy and two variables, θ1 and θ2. The surface is colored according to the Free Energy value, with lower values represented by purple and higher values by yellow. The plot shows how Free Energy changes as θ1 and θ2 vary.
### Components/Axes
* **X-axis**: θ1, ranging from approximately -5 to 5.
* **Y-axis**: θ2, ranging from approximately -5 to 5.
* **Z-axis**: Free Energy, ranging from -4.11 to -4.07.
### Detailed Analysis
The surface plot shows a relatively flat region at higher Free Energy values (yellow) and a steeper slope towards lower Free Energy values (purple).
* **Trend along θ1**: The Free Energy appears to be relatively constant as θ1 changes, especially at higher values of θ2.
* **Trend along θ2**: The Free Energy decreases as θ2 decreases, indicating a dependence on θ2.
Specific data points are difficult to extract precisely due to the nature of the 3D plot, but the general trend is clear.
### Key Observations
* The Free Energy is more sensitive to changes in θ2 than θ1.
* The minimum Free Energy appears to be located in the region where θ2 is at its lowest value (-5).
* The surface is relatively flat at higher Free Energy values, suggesting a plateau.
### Interpretation
The plot suggests that the system's Free Energy is primarily influenced by the value of θ2. Lowering θ2 leads to a decrease in Free Energy, potentially indicating a more stable or favorable state. The relative insensitivity to θ1 suggests that it has a less significant impact on the system's energy within the plotted range. The plateau at higher Free Energy values might represent a region of instability or a less favorable configuration.