\n
## 3D Surface Plot: Free Energy Landscape
### Overview
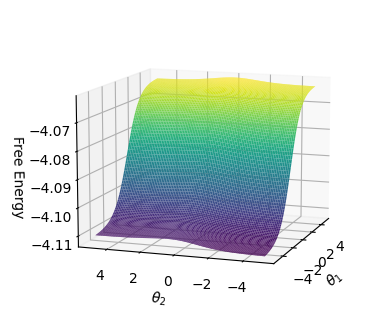
The image presents a 3D surface plot visualizing a free energy landscape as a function of two angular parameters, θ₁ and θ₂. The surface is colored to represent the free energy values, ranging from approximately -4.07 to -4.11. The plot appears to show a relatively smooth, undulating surface.
### Components/Axes
* **X-axis:** θ₂ (Theta 2), ranging from approximately -4 to 4.
* **Y-axis:** θ₁ (Theta 1), ranging from approximately -4 to 4.
* **Z-axis:** Free Energy, ranging from approximately -4.11 to -4.07.
* **Color Scale:** Represents Free Energy values. Purple/Dark Blue indicates lower free energy (approximately -4.11), transitioning through green and turquoise to yellow indicating higher free energy (approximately -4.07).
### Detailed Analysis
The surface exhibits a general trend of decreasing free energy as θ₂ decreases from 4 to -4, and as θ₁ decreases from 4 to -4. The lowest free energy values are concentrated in the bottom-left corner of the plot (θ₁ ≈ -4, θ₂ ≈ -4). The highest free energy values are located in the top-right corner (θ₁ ≈ 4, θ₂ ≈ 4).
The surface is not perfectly flat; there are subtle undulations and variations in free energy across the landscape. It's difficult to extract precise numerical values from the plot without the underlying data, but we can observe the following approximate characteristics:
* **Minimum Free Energy:** Approximately -4.11, located near θ₁ = -4 and θ₂ = -4.
* **Maximum Free Energy:** Approximately -4.07, located near θ₁ = 4 and θ₂ = 4.
* **Saddle Points/Local Minima/Maxima:** There appear to be some subtle saddle points or local minima/maxima, but they are not clearly defined without more precise data.
### Key Observations
* The free energy landscape is relatively smooth, suggesting a gradual change in energy as the angular parameters vary.
* The minimum free energy is located in the region where both θ₁ and θ₂ are negative.
* The maximum free energy is located in the region where both θ₁ and θ₂ are positive.
* The plot does not show any sharp discontinuities or abrupt changes in free energy.
### Interpretation
This plot likely represents the free energy landscape of a system with two rotational degrees of freedom, described by the angles θ₁ and θ₂. The shape of the landscape indicates the stability of different configurations of the system. The minimum free energy corresponds to the most stable configuration, while higher free energy values correspond to less stable configurations.
The fact that the minimum free energy is located at negative values of both θ₁ and θ₂ suggests that the system prefers configurations where both angles are negative. The smooth nature of the landscape suggests that the system can easily transition between different configurations without encountering significant energy barriers.
The plot could be used to study the dynamics of the system, such as the rate of transitions between different configurations or the effect of external forces on the system's behavior. The absence of sharp features suggests that the system is not prone to sudden jumps or instabilities. This could be a representation of a potential energy surface for a molecule or a simplified model of a more complex system.