## Heatmap: Token Flip Rate by Position Bucket
### Overview
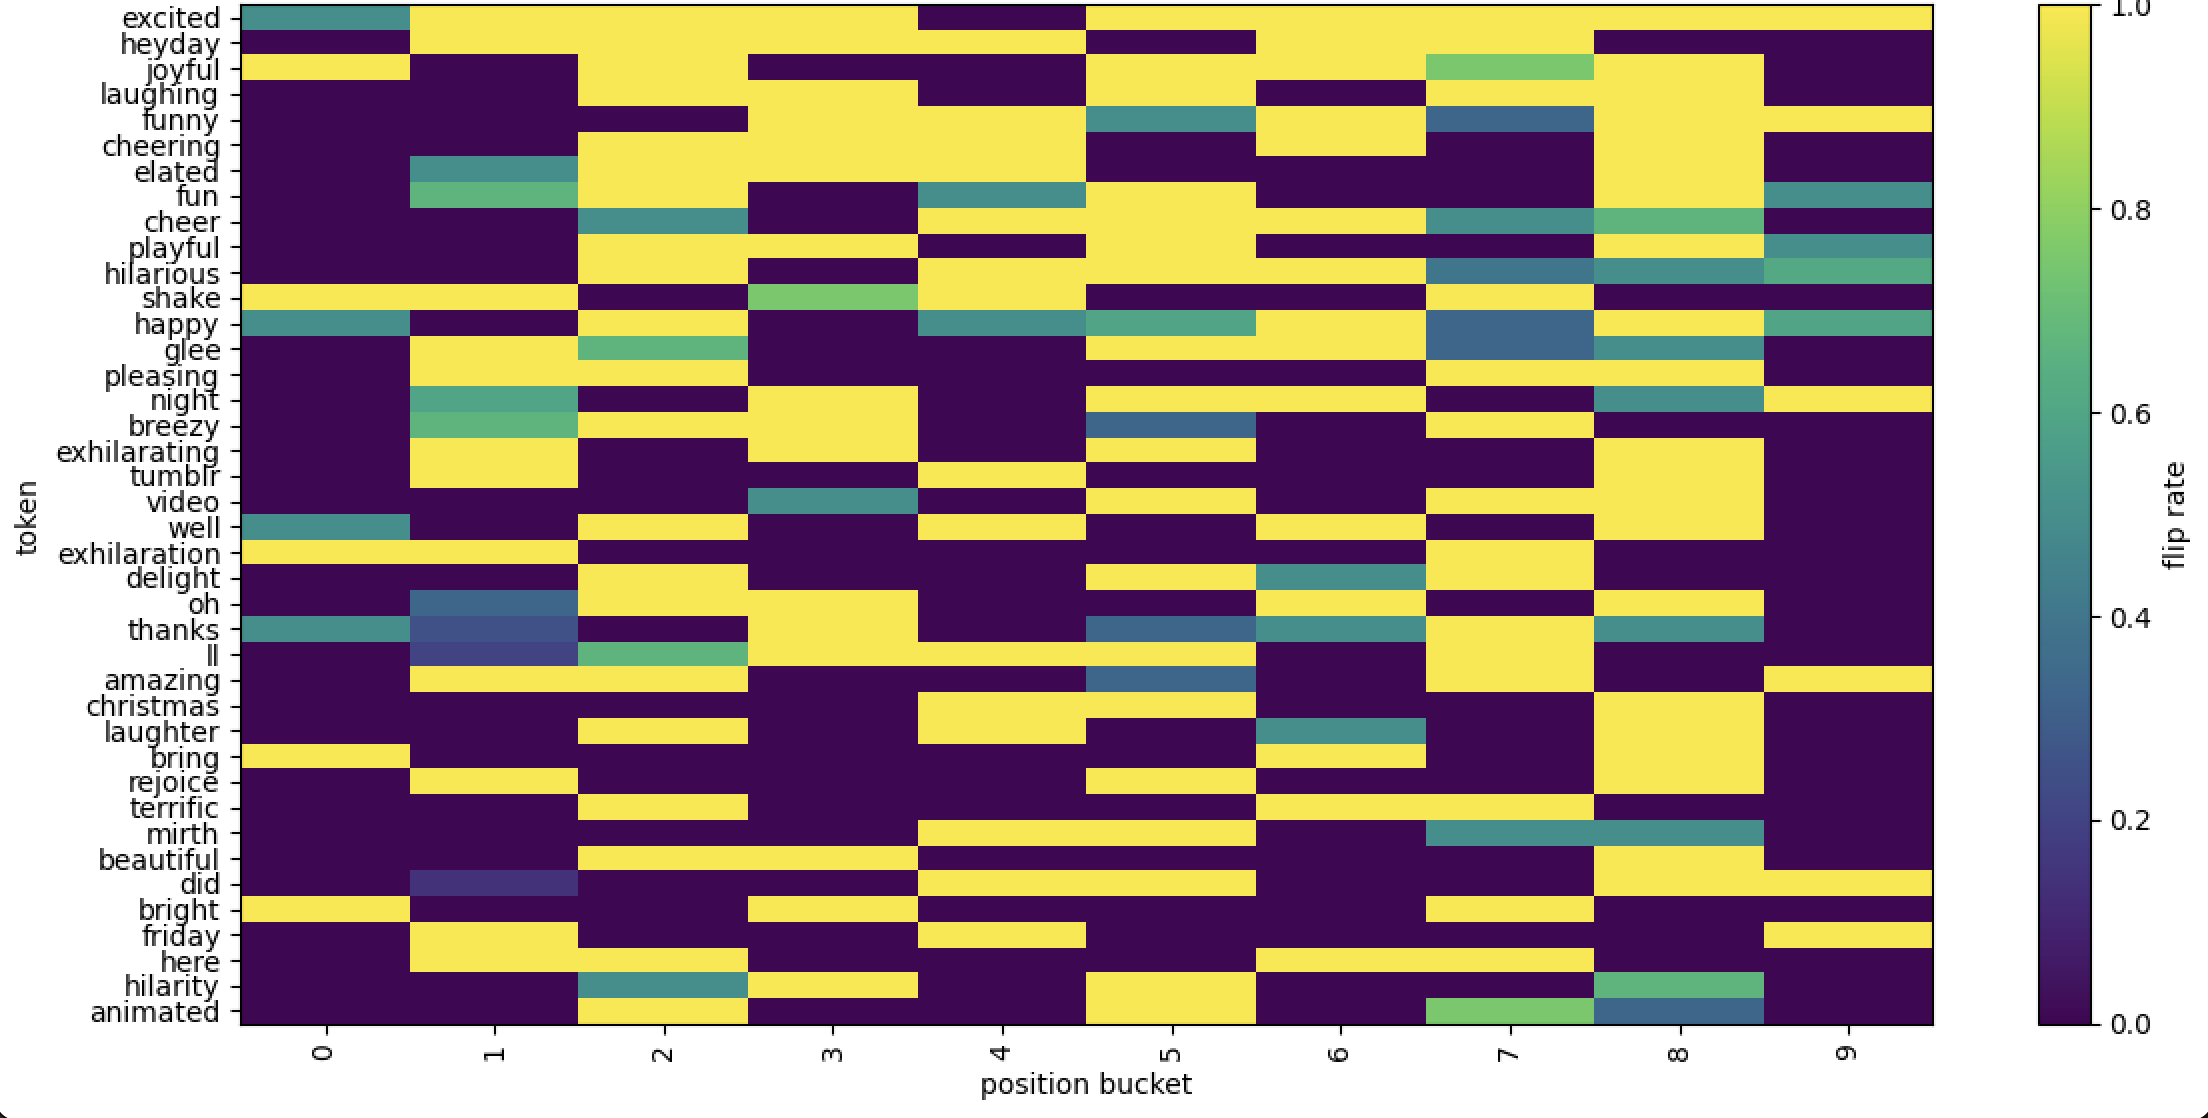
This image is a heatmap visualizing the "flip rate" of various tokens across different position buckets. The chart displays a grid where each cell's color represents a numerical value (flip rate) for a specific token at a specific position bucket. The tokens are listed vertically on the y-axis, and the position buckets are listed horizontally on the x-axis. A color scale bar on the right provides the key for interpreting the flip rate values.
### Components/Axes
* **Chart Type:** Heatmap.
* **Y-Axis (Vertical):** Labeled "token". It lists 40 distinct tokens (words/phrases). From top to bottom, they are:
`excited`, `heyday`, `joyful`, `laughing`, `funny`, `cheering`, `elated`, `fun`, `cheer`, `playful`, `hilarious`, `shake`, `happy`, `glee`, `pleasing`, `night`, `breezy`, `exhilarating`, `tumblr`, `video`, `well`, `exhilaration`, `delight`, `oh`, `thanks`, `ll`, `amazing`, `christmas`, `laughter`, `bring`, `rejoice`, `terrific`, `mirth`, `beautiful`, `did`, `bright`, `friday`, `here`, `hilarity`, `animated`.
* **X-Axis (Horizontal):** Labeled "position bucket". It displays 10 discrete buckets, numbered from `0` to `9`.
* **Color Scale/Legend:** Located on the right side of the chart. It is a vertical bar labeled "flip rate".
* **Scale Range:** 0.0 (bottom) to 1.0 (top).
* **Color Mapping:**
* Dark Purple/Indigo: ~0.0 - 0.2 (Low flip rate)
* Teal/Blue-Green: ~0.4 - 0.6 (Medium flip rate)
* Yellow: ~0.8 - 1.0 (High flip rate)
* The gradient transitions smoothly between these colors.
### Detailed Analysis
The heatmap shows the distribution of flip rates for each token across the 10 position buckets. The value in each cell is approximate, inferred from the color.
**General Pattern Observation:** There is significant variation both between tokens and across position buckets for the same token. No single token has a uniform color across all buckets.
**Token-Specific Trends (Selected Examples):**
* **`excited`:** Shows a high flip rate (yellow) in buckets 1, 2, 3, 4, 5, 8, and 9. It has a medium rate (teal) in bucket 0 and a low rate (purple) in buckets 6 and 7.
* **`heyday`:** Predominantly low flip rate (purple) across most buckets, with high rates (yellow) only in buckets 2, 3, and 4.
* **`joyful`:** High rates (yellow) in buckets 0, 1, 2, 3, 4, 5, 8, and 9. Medium rate (green) in bucket 7. Low rate (purple) in bucket 6.
* **`funny`:** High rates (yellow) in buckets 2, 3, 4, 5, 8, and 9. Medium rates (teal) in buckets 6 and 7. Low rate (purple) in buckets 0 and 1.
* **`happy`:** High rates (yellow) in buckets 2, 3, 4, 5, 8, and 9. Medium rates (teal) in buckets 0 and 7. Low rate (purple) in buckets 1 and 6.
* **`night`:** High rates (yellow) in buckets 1, 2, 3, 5, 8, and 9. Medium rates (teal) in buckets 0 and 7. Low rate (purple) in buckets 4 and 6.
* **`christmas`:** Shows a very distinct pattern. It has a high flip rate (yellow) only in bucket 9. All other buckets (0-8) are dark purple, indicating a very low flip rate (~0.0).
* **`friday`:** Similar to `christmas`, it has a high rate (yellow) only in bucket 9, with low rates elsewhere.
* **`ll`:** Shows a high rate (yellow) in buckets 3, 4, 5, 6, and 7. Medium rates (teal/green) in buckets 2 and 8. Low rates in buckets 0, 1, and 9.
**Position Bucket Trends:**
* **Bucket 0:** Contains a mix of low (purple) and medium (teal) values. Notable high-rate tokens here are `joyful`, `shake`, and `bright`.
* **Bucket 9:** Contains a high concentration of high flip rate (yellow) tokens, including `excited`, `joyful`, `funny`, `happy`, `night`, `amazing`, `christmas`, `friday`, and `animated`.
* **Buckets 4 & 5:** Also show a high density of yellow cells across many tokens.
### Key Observations
1. **Cluster of High Activity:** Buckets 2, 3, 4, 5, 8, and 9 frequently show high flip rates (yellow) for many tokens, suggesting these positions are associated with higher token "flip" behavior.
2. **Low Activity Buckets:** Buckets 0, 1, 6, and 7 have more purple and teal cells, indicating generally lower flip rates.
3. **Token Specificity:** Some tokens have very localized high flip rates. The most extreme examples are `christmas` and `friday`, which are only high in bucket 9. `ll` has a distinct high-rate cluster in the middle buckets (3-7).
4. **Visual Outliers:** The rows for `christmas` and `friday` are visually striking due to their almost entirely purple background with a single yellow cell at the far right (bucket 9).
### Interpretation
This heatmap likely visualizes the results of an experiment or analysis tracking how often ("flip rate") specific words (tokens) change their state, prediction, or association when they appear at different positions (buckets) within a sequence or document.
* **What the data suggests:** The flip rate is not uniform. It is highly dependent on both the specific word and its positional context. Words related to positive emotion (`joyful`, `happy`, `excited`) and general terms (`funny`, `amazing`) tend to have higher flip rates across many positions. In contrast, context-specific nouns (`christmas`, `friday`) have a very high flip rate only at a specific position (bucket 9), which might correspond to the end of a sequence or a specific segment where their relevance changes dramatically.
* **Relationship between elements:** The x-axis (position bucket) likely represents a normalized or binned measure of location within an input (e.g., first 10%, second 10%, etc.). The y-axis represents the vocabulary of interest. The color (flip rate) is the measured outcome. The chart reveals an interaction effect: the effect of position on flip rate varies by token.
* **Potential meaning:** In a machine learning or NLP context, this could indicate that the model's confidence or internal representation for certain words is more volatile (prone to "flipping") at specific points in a text. For example, the model might be very certain about the meaning of "christmas" until it reaches the final segment (bucket 9), where new context causes a significant re-evaluation (high flip rate). Conversely, emotion words might be consistently re-evaluated throughout the sequence. This information could be used to understand model behavior, identify critical context windows, or improve model stability.