## Workflow Diagram: Data-Driven Visual Storytelling Design Space
### Overview
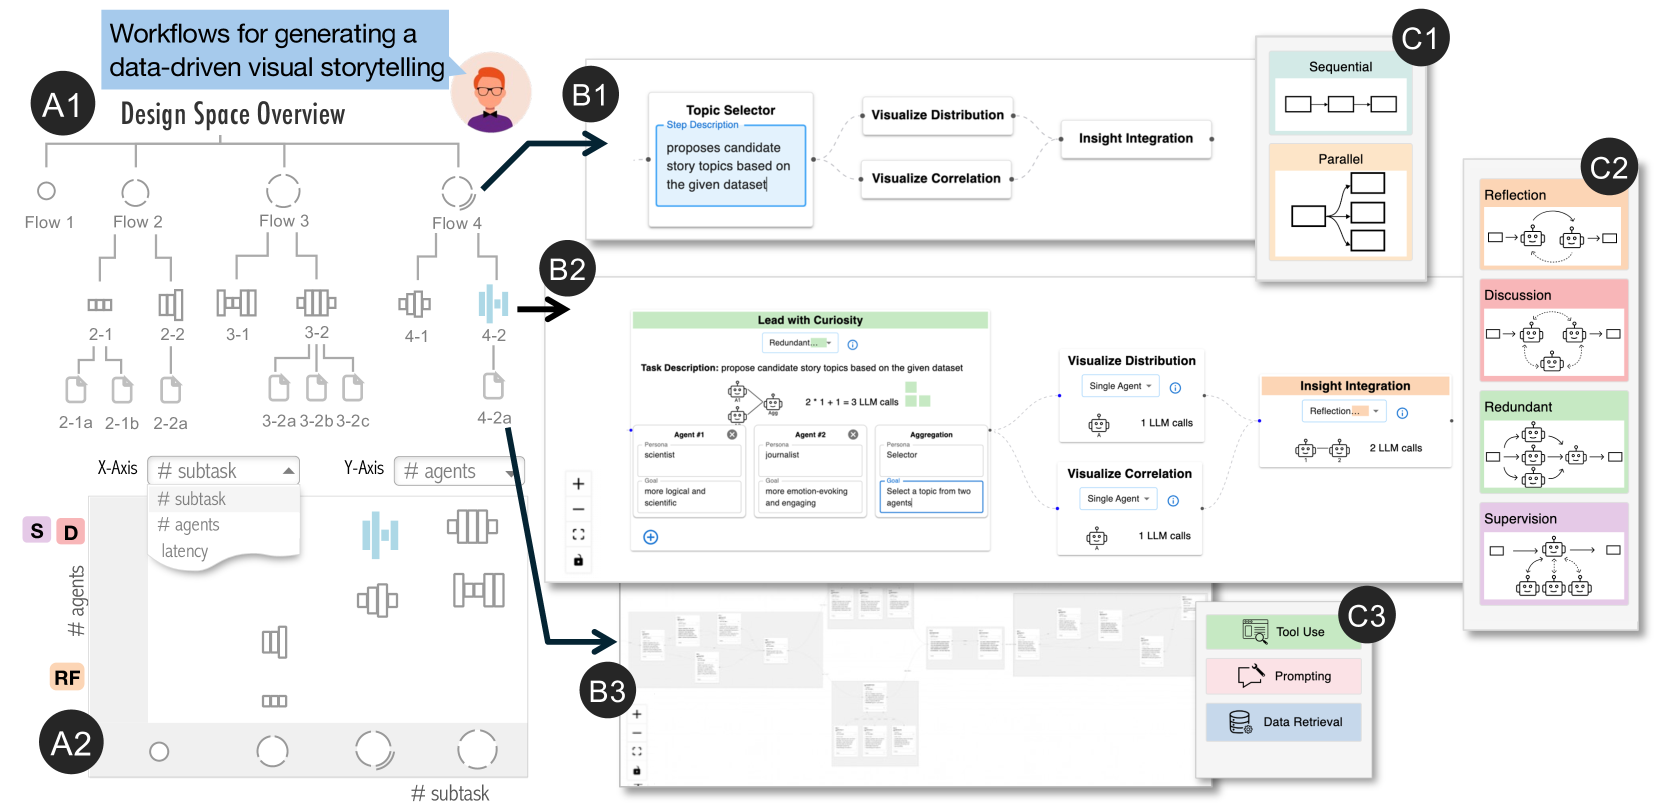
The image presents a workflow diagram outlining the design space for generating data-driven visual storytelling. It includes several interconnected components, including design space overview, topic selection, agent interaction, and workflow patterns.
### Components/Axes
**A1: Design Space Overview**
* Title: Workflows for generating a data-driven visual storytelling.
* Subtitle: Design Space Overview.
* Flows: Four flows are depicted (Flow 1, Flow 2, Flow 3, Flow 4). Each flow branches into sub-flows and tasks.
* Flow 1: Branches into 2-1 and 2-2. 2-1 branches into 2-1a and 2-1b. 2-2 branches into 2-2a.
* Flow 2: Branches into 2-1 and 2-2. 2-1 branches into 2-1a and 2-1b. 2-2 branches into 2-2a.
* Flow 3: Branches into 3-1 and 3-2. 3-2 branches into 3-2a, 3-2b, and 3-2c.
* Flow 4: Branches into 4-1 and 4-2. 4-2 branches into 4-2a.
**A2: X-Axis/Y-Axis Selection**
* X-Axis: Dropdown menu with options "#subtask", "#agents", and "latency". Currently selected is "#subtask".
* Y-Axis: Dropdown menu with options "#agents". Currently selected is "#agents".
* Visualizations: A series of icons representing different data visualizations based on the selected X and Y axes.
**B1: Topic Selector**
* Title: Topic Selector
* Subtitle: Step Description
* Description: "proposes candidate story topics based on the given dataset"
* Connected to: "Visualize Distribution" and "Visualize Correlation"
**B2: Lead with Curiosity**
* Title: Lead with Curiosity
* Subtitle: Redundant...
* Task Description: "propose candidate story topics based on the given dataset"
* LLM Calls: "2 * 1 + 1 = 3 LLM calls"
* Agents:
* Agent #1: Persona - scientist; Goal - more logical and scientific.
* Agent #2: Persona - journalist; Goal - more emotion-evoking and engaging.
* Aggregation: Persona - Selector; Goal - Select a topic from two agents.
**B3: Unspecified**
* Appears to be a zoomed-out view of the workflow, possibly for navigation.
**C1: Workflow Patterns - Sequential and Parallel**
* Sequential: A series of connected rectangles.
* Parallel: One rectangle branching into three rectangles.
**C2: Workflow Patterns - Reflection, Discussion, Redundant, Supervision**
* Reflection: A rectangle connected to a loop involving two agent icons.
* Discussion: A rectangle connected to a loop involving two agent icons, with dotted lines indicating interaction.
* Redundant: A rectangle connected to a series of three agent icons in a row, then to another rectangle.
* Supervision: A rectangle connected to a branching structure involving agent icons, then to another rectangle.
**C3: Tool Use**
* Tool Use: Icon of a document with a wrench.
* Prompting: Icon of a speech bubble with a pencil.
* Data Retrieval: Icon of a database.
### Detailed Analysis or ### Content Details
* **Flows (A1):** The diagram starts with four high-level flows, each branching into more specific tasks. The number of sub-tasks varies across flows.
* **Axis Selection (A2):** The X and Y axes can be configured to represent different variables, such as "#subtask", "#agents", and "latency". The selected axes influence the type of data visualization displayed.
* **Topic Selection (B1):** The "Topic Selector" component proposes candidate story topics based on the dataset.
* **Agent Interaction (B2):** The "Lead with Curiosity" component involves interaction between different agents (scientist, journalist, selector) to refine the story topics.
* **Workflow Patterns (C1, C2):** The diagram illustrates different workflow patterns, including sequential, parallel, reflection, discussion, redundant, and supervision.
* **Tool Use (C3):** The diagram highlights the use of tools for prompting and data retrieval.
### Key Observations
* The diagram provides a structured overview of the design space for data-driven visual storytelling.
* The workflow involves multiple stages, including topic selection, agent interaction, data visualization, and insight integration.
* The diagram emphasizes the importance of collaboration between different agents (e.g., scientists and journalists) to create compelling stories.
* The use of different workflow patterns allows for flexibility and adaptability in the storytelling process.
### Interpretation
The diagram illustrates a complex workflow for generating data-driven visual storytelling. It highlights the iterative nature of the process, involving multiple agents, tools, and workflow patterns. The ability to select different X and Y axes for visualization allows for exploring different perspectives on the data. The diagram suggests that effective data-driven storytelling requires a combination of data analysis, creative writing, and collaboration. The "Lead with Curiosity" component emphasizes the importance of asking the right questions and exploring different angles to uncover meaningful insights.