## Line Charts: Relative Reconstruction Error vs. Calibration Tokens
### Overview
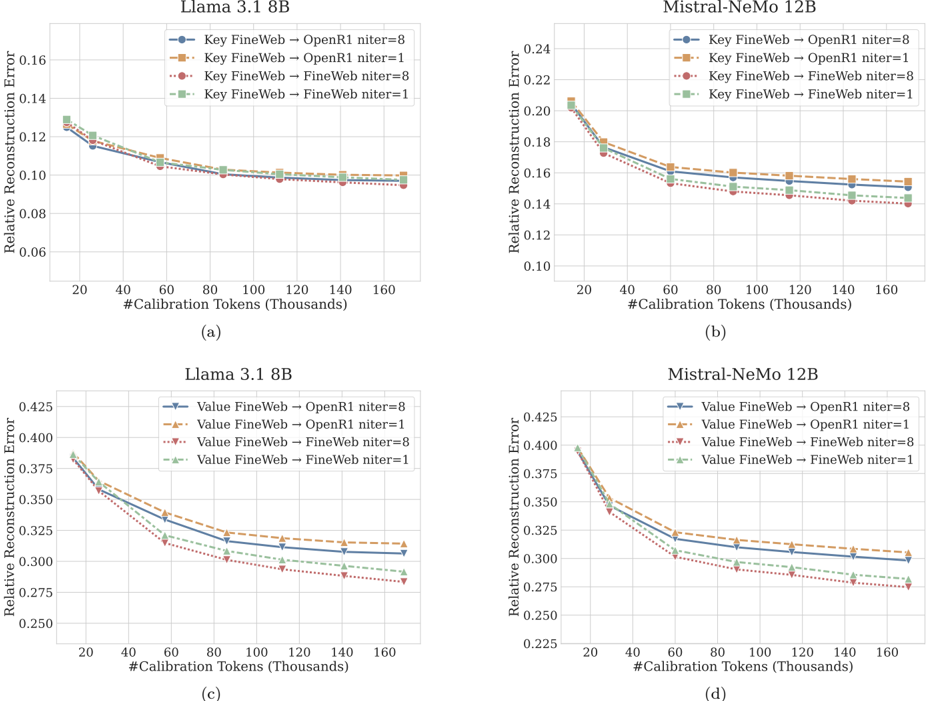
The image presents a 2x2 grid of line charts comparing the "Relative Reconstruction Error" against the number of calibration tokens (in thousands) for two different Large Language Models (LLMs): **Llama 3.1 8B** and **Mistral-NeMo 12B**. The charts are categorized by the parameter type being calibrated: "Key" (top row) and "Value" (bottom row). Each chart evaluates four different calibration configurations involving two datasets (FineWeb, OpenR1) and two iteration counts (niter=1, niter=8).
### Components/Axes
* **X-Axis (All Charts):** "#Calibration Tokens (Thousands)". The scale is linear, ranging from 20 to 160, with major ticks every 20 units.
* **Y-Axis (All Charts):** "Relative Reconstruction Error". The scale varies by chart to accommodate different error magnitudes.
* **Legend Structure:**
* **Charts (a) & (b) [Key]:**
* Blue (Circle): Key FineWeb → OpenR1 niter=8
* Orange (Square): Key FineWeb → OpenR1 niter=1
* Red (Circle): Key FineWeb → FineWeb niter=8
* Green (Square): Key FineWeb → FineWeb niter=1
* **Charts (c) & (d) [Value]:**
* Blue (Triangle Down): Value FineWeb → OpenR1 niter=8
* Orange (Triangle Up): Value FineWeb → OpenR1 niter=1
* Red (Triangle Down): Value FineWeb → FineWeb niter=8
* Green (Triangle Up): Value FineWeb → FineWeb niter=1
---
### Detailed Analysis
#### (a) Llama 3.1 8B (Key)
* **Trend:** All four lines show a consistent downward slope as the number of calibration tokens increases from 20k to 160k. The most rapid decrease occurs between 20k and 60k tokens, after which the curves flatten.
* **Data Points:**
* Starts at ~0.125–0.130 at 20k tokens.
* Ends at ~0.095–0.100 at 160k tokens.
* **Ranking:** The Red line (niter=8) is consistently the lowest (best performance), while the Orange line (niter=1) is consistently the highest (worst performance).
#### (b) Mistral-NeMo 12B (Key)
* **Trend:** Similar to (a), all lines slope downward. The error values are higher overall than in chart (a).
* **Data Points:**
* Starts at ~0.205 at 20k tokens.
* Ends at ~0.140–0.155 at 160k tokens.
* **Ranking:** The Red line (niter=8) is the lowest, followed closely by the Blue line. The Orange line (niter=1) remains the highest.
#### (c) Llama 3.1 8B (Value)
* **Trend:** A steeper initial decline compared to the "Key" charts. The error drops significantly from 20k to 60k tokens.
* **Data Points:**
* Starts at ~0.385 at 20k tokens.
* Ends at ~0.285–0.315 at 160k tokens.
* **Ranking:** The Red line (niter=8) is the lowest, followed by the Green line. The Orange line (niter=1) is the highest.
#### (d) Mistral-NeMo 12B (Value)
* **Trend:** Consistent downward slope. The error range is similar to chart (c).
* **Data Points:**
* Starts at ~0.395–0.400 at 20k tokens.
* Ends at ~0.275–0.305 at 160k tokens.
* **Ranking:** The Red line (niter=8) is the lowest, followed by the Green line. The Orange line (niter=1) is the highest.
---
### Key Observations
1. **Consistent Performance Hierarchy:** Across all four charts, the configuration **"niter=8" with "FineWeb" (Red line)** consistently yields the lowest Relative Reconstruction Error. Conversely, **"niter=1" with "OpenR1" (Orange line)** consistently yields the highest error.
2. **Parameter Sensitivity:** The "Value" parameters (charts c, d) exhibit significantly higher reconstruction errors (ranging roughly from 0.27 to 0.40) compared to the "Key" parameters (charts a, b, ranging roughly from 0.09 to 0.21). This suggests that "Value" parameters are more sensitive to the calibration process or harder to reconstruct accurately.
3. **Diminishing Returns:** In all scenarios, the benefit of adding more calibration tokens diminishes rapidly after 60k–80k tokens. Increasing tokens from 120k to 160k provides negligible improvements in reconstruction error.
### Interpretation
The data demonstrates that calibration quality is highly dependent on the number of iterations (`niter`) and the calibration dataset used.
* **Iteration Impact:** Higher iteration counts (niter=8) consistently outperform lower counts (niter=1), suggesting that iterative optimization is crucial for minimizing reconstruction error during model calibration (likely for quantization).
* **Dataset Impact:** The "FineWeb" dataset appears to be a more effective calibration source than "OpenR1" for these specific models, as evidenced by the Red (FineWeb, niter=8) and Green (FineWeb, niter=1) lines generally performing better than their Blue/Orange counterparts.
* **Model/Parameter Behavior:** The distinct difference in error scales between "Key" and "Value" parameters indicates that these components of the Transformer architecture have different stability profiles. The "Value" projection matrices are likely more volatile or complex, requiring more robust calibration to achieve low reconstruction error compared to the "Key" projection matrices.