## Line Chart: Loss vs. FLOPS for Vanilla and Pondering Pythia-70M
### Overview
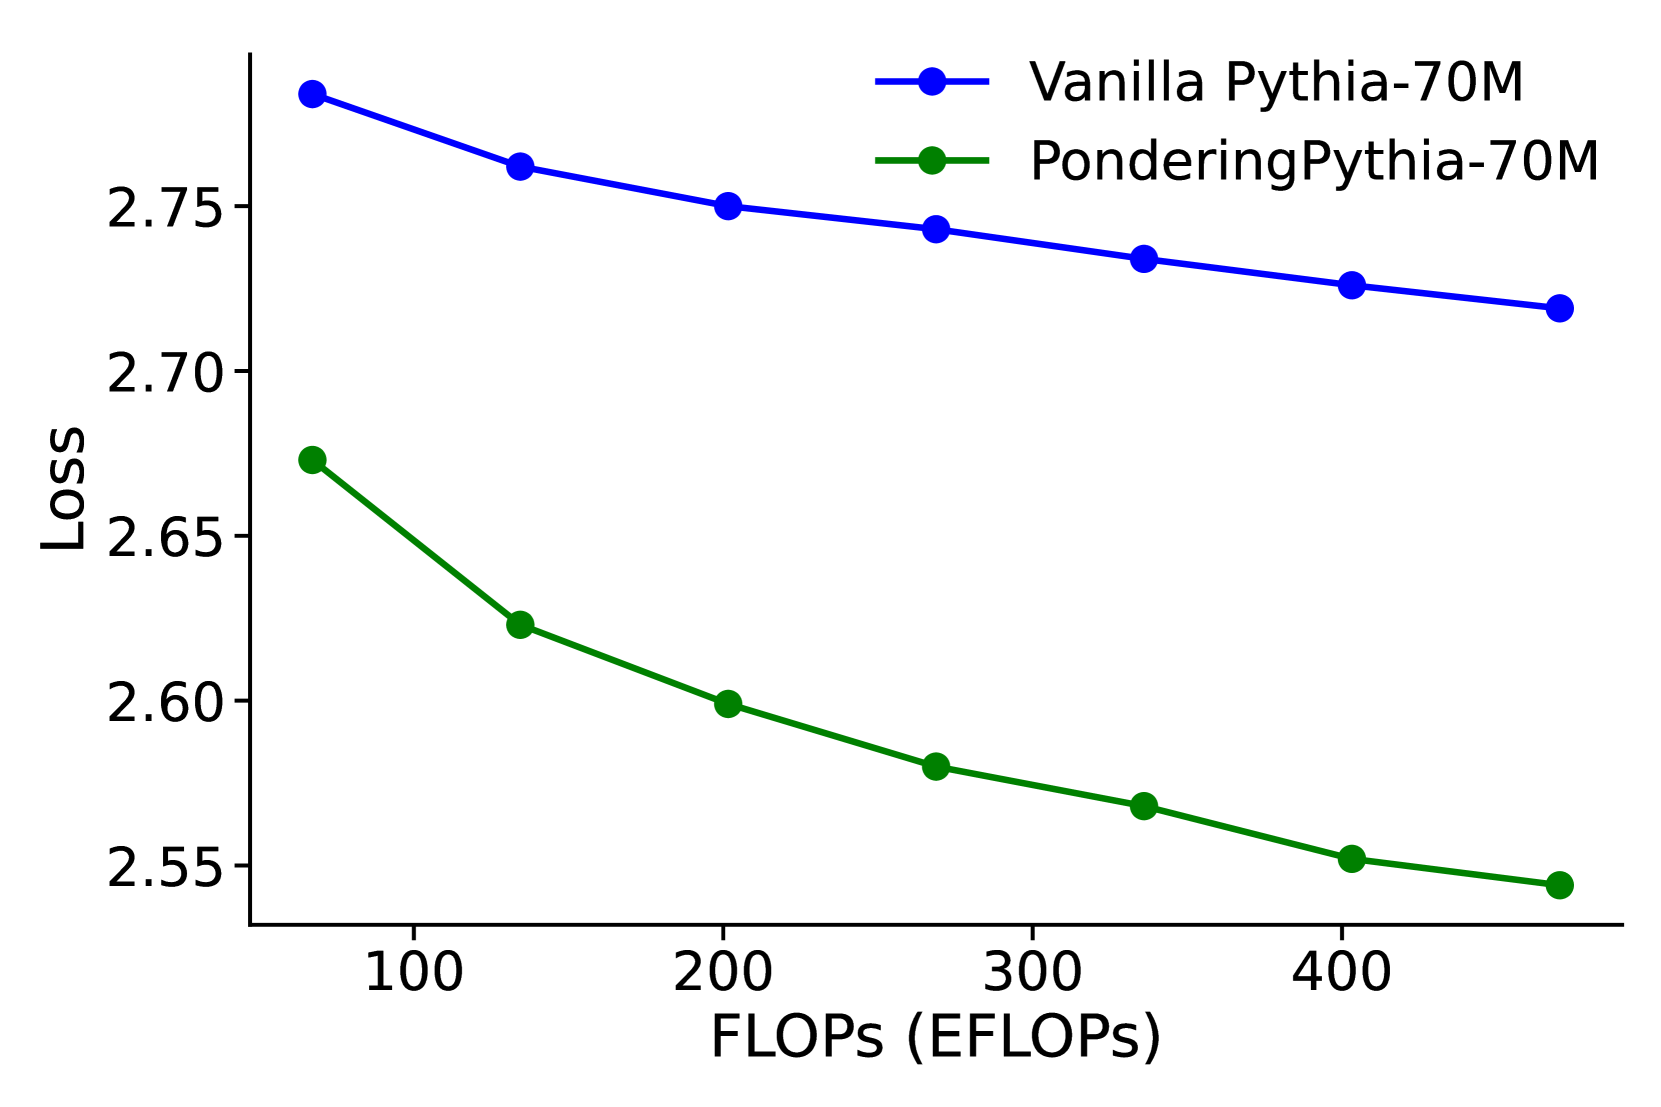
The image is a line chart comparing the loss of two language models, "Vanilla Pythia-70M" and "Pondering Pythia-70M", as a function of FLOPS (EFLOPs). The x-axis represents FLOPS (EFLOPs), and the y-axis represents Loss. Both models show a decrease in loss as FLOPS increase, but "Pondering Pythia-70M" consistently exhibits lower loss values than "Vanilla Pythia-70M".
### Components/Axes
* **Title:** Implicit, but the chart compares the performance of "Vanilla Pythia-70M" and "Pondering Pythia-70M".
* **X-axis:** FLOPS (EFLOPs)
* Scale: 100, 200, 300, 400
* **Y-axis:** Loss
* Scale: 2.55, 2.60, 2.65, 2.70, 2.75
* **Legend:** Located in the top-right corner.
* Blue line with circle markers: Vanilla Pythia-70M
* Green line with circle markers: Pondering Pythia-70M
### Detailed Analysis
* **Vanilla Pythia-70M (Blue):** The loss decreases as FLOPS increase.
* At 75 EFLOPs, Loss is approximately 2.78.
* At 150 EFLOPs, Loss is approximately 2.76.
* At 225 EFLOPs, Loss is approximately 2.75.
* At 300 EFLOPs, Loss is approximately 2.74.
* At 400 EFLOPs, Loss is approximately 2.73.
* At 450 EFLOPs, Loss is approximately 2.72.
* **Pondering Pythia-70M (Green):** The loss decreases as FLOPS increase.
* At 75 EFLOPs, Loss is approximately 2.67.
* At 150 EFLOPs, Loss is approximately 2.62.
* At 225 EFLOPs, Loss is approximately 2.60.
* At 300 EFLOPs, Loss is approximately 2.58.
* At 400 EFLOPs, Loss is approximately 2.55.
* At 450 EFLOPs, Loss is approximately 2.54.
### Key Observations
* Both models exhibit a decreasing loss trend as FLOPS increase.
* "Pondering Pythia-70M" consistently outperforms "Vanilla Pythia-70M" in terms of loss at all FLOPS values.
* The rate of loss decrease appears to diminish as FLOPS increase for both models.
### Interpretation
The chart demonstrates that increasing the computational resources (FLOPS) leads to a reduction in loss for both "Vanilla Pythia-70M" and "Pondering Pythia-70M" language models. The "Pondering Pythia-70M" model consistently achieves lower loss values compared to the "Vanilla Pythia-70M" model, suggesting that the "Pondering" architecture is more efficient or effective in reducing loss for a given amount of computation. The diminishing rate of loss decrease suggests that there may be a point of diminishing returns in increasing FLOPS for these models.