\n
## Line Chart: Loss vs. FLOPS for Pythia Models
### Overview
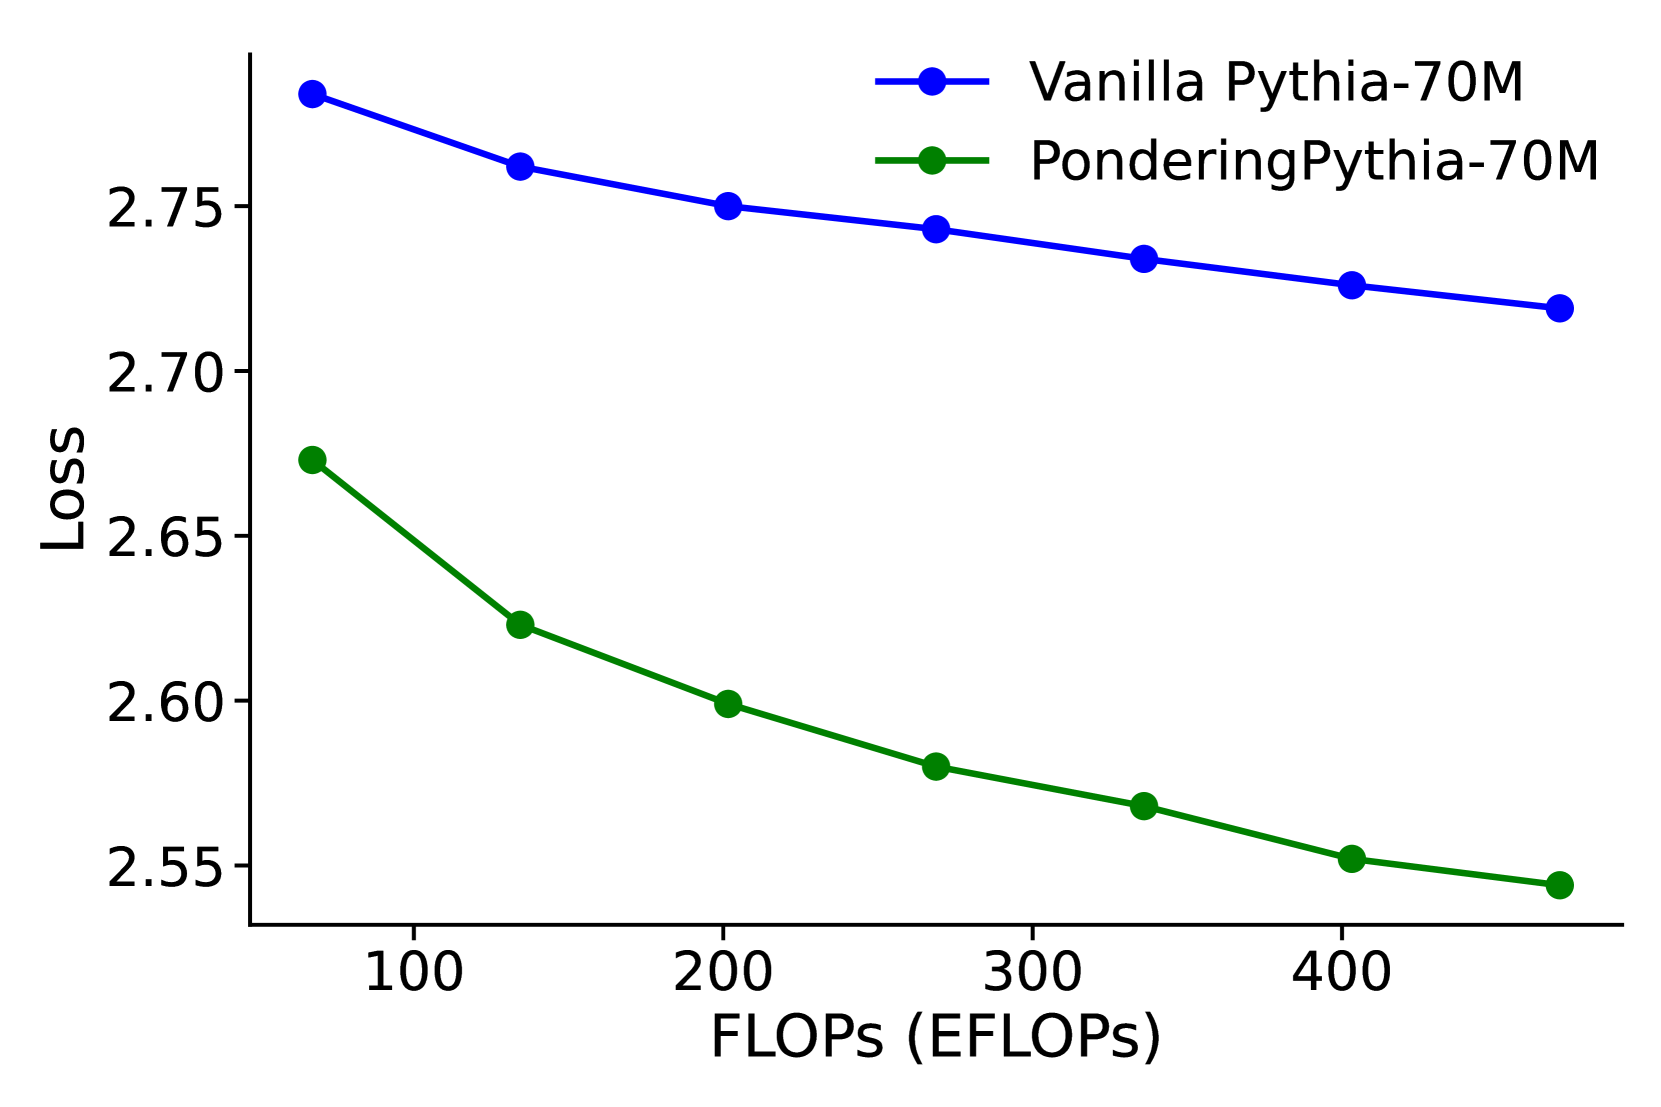
This image presents a line chart comparing the loss values of two Pythia models – "Vanilla Pythia-70M" and "PonderingPythia-70M" – as a function of FLOPS (EFLOPs). The chart illustrates how the loss decreases for both models as the computational effort (FLOPS) increases.
### Components/Axes
* **X-axis:** FLOPS (EFLOPs), ranging from approximately 80 to 420.
* **Y-axis:** Loss, ranging from approximately 2.54 to 2.80.
* **Data Series 1:** Vanilla Pythia-70M (represented by a blue line with circular markers).
* **Data Series 2:** PonderingPythia-70M (represented by a green line with circular markers).
* **Legend:** Located in the top-right corner, clearly labeling each data series with its corresponding color.
### Detailed Analysis
**Vanilla Pythia-70M (Blue Line):**
The blue line exhibits a downward trend, indicating decreasing loss with increasing FLOPS.
* At approximately 80 FLOPS, the loss is around 2.79.
* At approximately 160 FLOPS, the loss is around 2.76.
* At approximately 240 FLOPS, the loss is around 2.74.
* At approximately 320 FLOPS, the loss is around 2.73.
* At approximately 400 FLOPS, the loss is around 2.72.
**PonderingPythia-70M (Green Line):**
The green line also shows a downward trend, but the loss decreases more rapidly than that of the Vanilla Pythia-70M.
* At approximately 80 FLOPS, the loss is around 2.67.
* At approximately 160 FLOPS, the loss is around 2.61.
* At approximately 240 FLOPS, the loss is around 2.59.
* At approximately 320 FLOPS, the loss is around 2.57.
* At approximately 400 FLOPS, the loss is around 2.55.
### Key Observations
* PonderingPythia-70M consistently exhibits lower loss values than Vanilla Pythia-70M across the entire range of FLOPS.
* The rate of loss reduction is steeper for PonderingPythia-70M, especially at lower FLOPS values.
* Both models demonstrate diminishing returns in loss reduction as FLOPS increase beyond 320.
### Interpretation
The chart suggests that PonderingPythia-70M is a more efficient model than Vanilla Pythia-70M, achieving lower loss values for a given amount of computational effort (FLOPS). The steeper initial decline in loss for PonderingPythia-70M indicates that it benefits more from increased computational resources, particularly at lower FLOPS levels. The diminishing returns observed at higher FLOPS suggest that there's a point where further increasing FLOPS yields only marginal improvements in model performance (loss reduction). This could be due to factors like model saturation or the limitations of the training data. The data implies that PonderingPythia-70M is a better choice when computational resources are limited, or when maximizing performance within a specific FLOPS budget is crucial.