## Line Chart: Loss vs. Computational Cost (FLOPs) for Two Language Models
### Overview
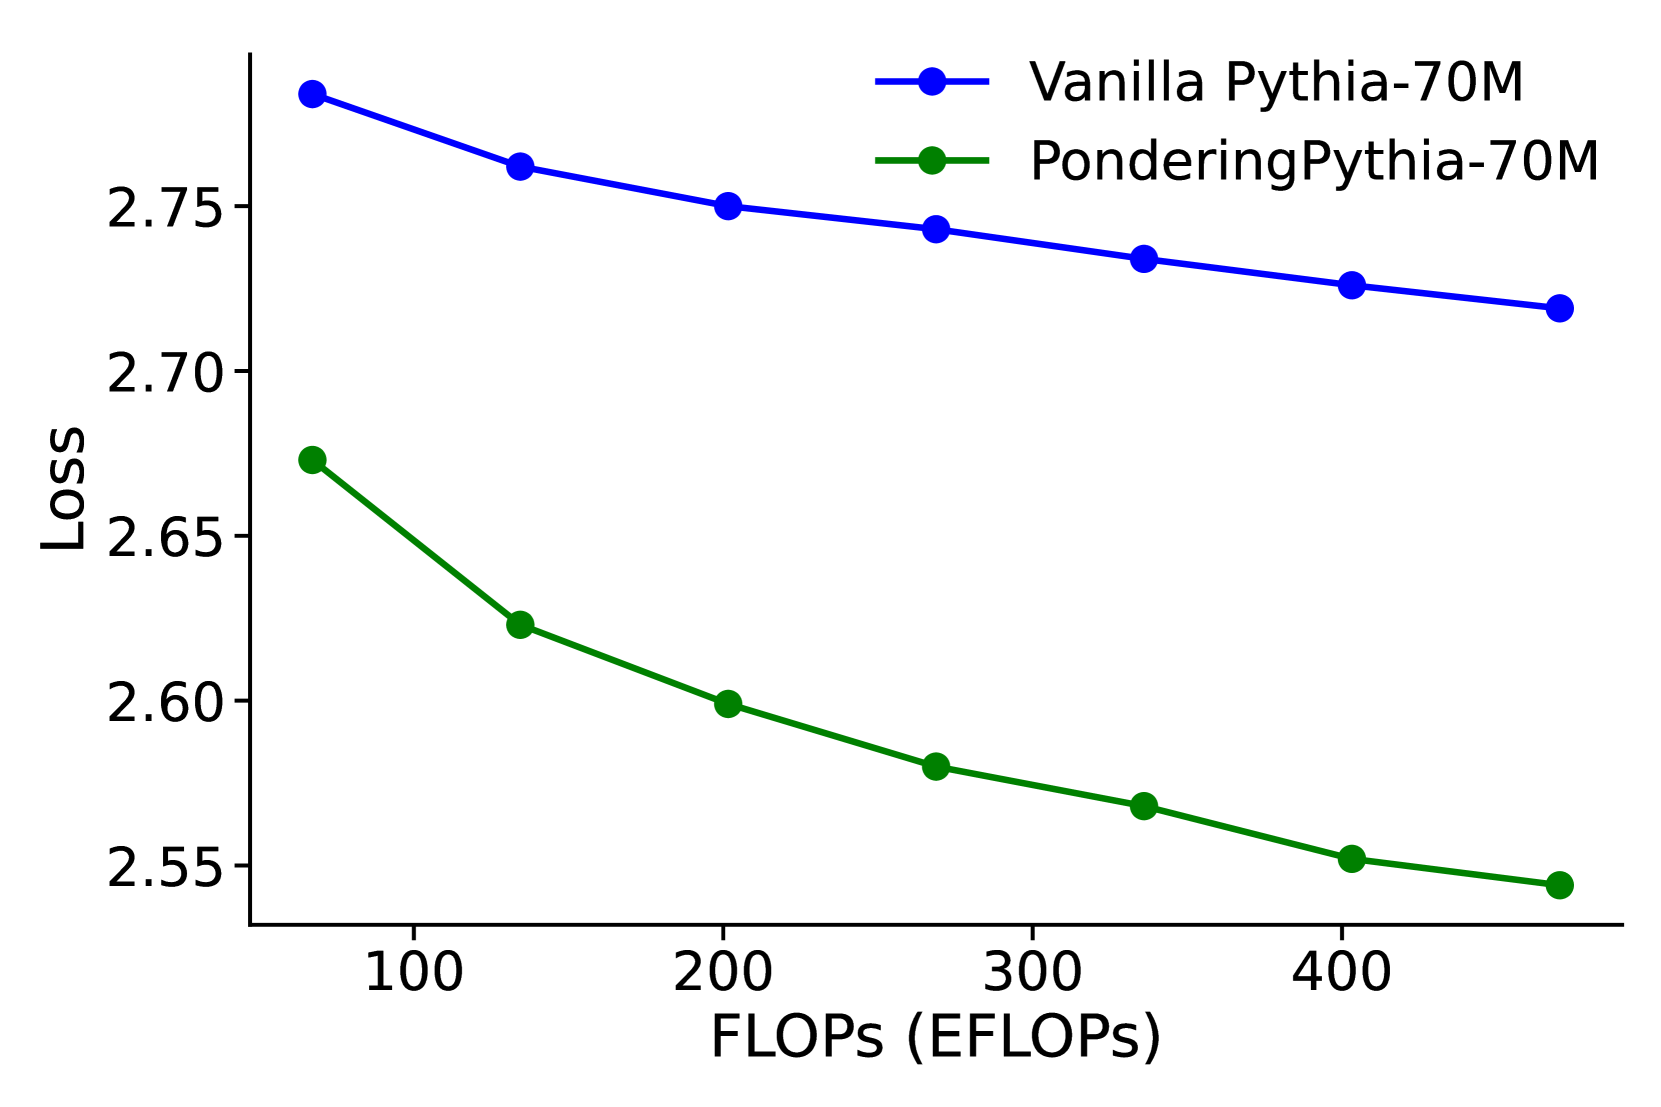
This image is a line chart comparing the performance of two language models, "Vanilla Pythia-70M" and "PonderingPythia-70M," by plotting their loss against computational cost measured in ExaFLOPs (EFLOPs). The chart demonstrates how the loss metric decreases for both models as the computational budget increases, with one model consistently outperforming the other.
### Components/Axes
* **Chart Type:** Line chart with markers.
* **Y-Axis (Vertical):**
* **Label:** "Loss"
* **Scale:** Linear, ranging from approximately 2.55 to 2.80.
* **Major Ticks:** 2.55, 2.60, 2.65, 2.70, 2.75.
* **X-Axis (Horizontal):**
* **Label:** "FLOPs (EFLOPs)"
* **Scale:** Linear, ranging from approximately 50 to 450 EFLOPs.
* **Major Ticks:** 100, 200, 300, 400.
* **Legend:**
* **Position:** Top-right corner of the chart area.
* **Entry 1:** A blue line with circular markers labeled "Vanilla Pythia-70M".
* **Entry 2:** A green line with circular markers labeled "PonderingPythia-70M".
### Detailed Analysis
**Data Series 1: Vanilla Pythia-70M (Blue Line)**
* **Trend Verification:** The blue line shows a steady, monotonic downward slope from left to right, indicating that loss decreases as computational cost (FLOPs) increases.
* **Data Points (Approximate):**
* At ~50 EFLOPs: Loss ≈ 2.78
* At ~130 EFLOPs: Loss ≈ 2.76
* At ~200 EFLOPs: Loss ≈ 2.75
* At ~270 EFLOPs: Loss ≈ 2.74
* At ~340 EFLOPs: Loss ≈ 2.73
* At ~410 EFLOPs: Loss ≈ 2.72
* At ~450 EFLOPs: Loss ≈ 2.72
**Data Series 2: PonderingPythia-70M (Green Line)**
* **Trend Verification:** The green line also shows a consistent downward slope, starting at a lower loss value than the blue line and maintaining a lower loss throughout the plotted range.
* **Data Points (Approximate):**
* At ~50 EFLOPs: Loss ≈ 2.67
* At ~130 EFLOPs: Loss ≈ 2.62
* At ~200 EFLOPs: Loss ≈ 2.60
* At ~270 EFLOPs: Loss ≈ 2.58
* At ~340 EFLOPs: Loss ≈ 2.57
* At ~410 EFLOPs: Loss ≈ 2.55
* At ~450 EFLOPs: Loss ≈ 2.54
### Key Observations
1. **Performance Gap:** The "PonderingPythia-70M" model (green) achieves a consistently lower loss than the "Vanilla Pythia-70M" model (blue) at every comparable computational cost point.
2. **Scaling Behavior:** Both models exhibit a diminishing returns pattern; the rate of loss improvement slows as FLOPs increase (the curves flatten slightly).
3. **Relative Improvement:** The absolute gap in loss between the two models appears to widen slightly as computational cost increases. At ~50 EFLOPs, the gap is ~0.11. At ~450 EFLOPs, the gap is ~0.18.
4. **No Outliers:** Both data series follow smooth, predictable trajectories without anomalous spikes or dips.
### Interpretation
The chart provides a direct comparison of computational efficiency between two variants of a 70-million-parameter language model. The core finding is that the "PonderingPythia" modification yields a significant and consistent improvement in model performance (lower loss) for any given amount of computational expenditure (FLOPs).
This suggests that the "Pondering" technique likely introduces a more efficient architecture or training methodology, allowing the model to extract more performance per unit of compute. The widening gap at higher FLOPs could indicate that this efficiency advantage scales well, making the modified model particularly beneficial for large-scale training runs where computational cost is a primary constraint. The data strongly advocates for the use of the "PonderingPythia" approach over the "Vanilla" version when optimizing for the loss-compute trade-off.