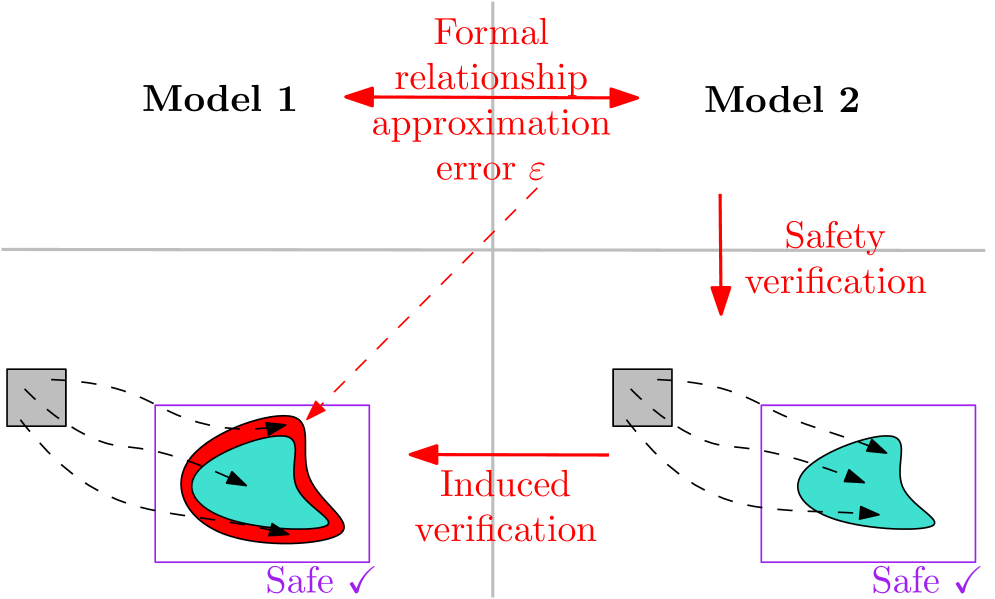
## Diagram: Model Safety Verification and Approximation Relationship
### Overview
The diagram illustrates a comparative analysis of two computational models (Model 1 and Model 2) with respect to safety verification and formal relationship approximation. It highlights the trade-offs between model complexity, safety guarantees, and approximation errors.
### Components/Axes
1. **Models**:
- **Model 1**: Positioned on the left, represented by a gray box with a purple-outlined safe region containing a cyan shape and black arrows indicating internal processes.
- **Model 2**: Positioned on the right, similarly structured but with a smaller safe region.
2. **Formal Relationship Approximation Error (ε)**:
- A dashed red line connecting Model 1 and Model 2, labeled with bidirectional arrows indicating mutual approximation.
3. **Safety Verification**:
- A red downward arrow from Model 2 to its safe region, labeled "Safety verification."
4. **Induced Verification**:
- A red rightward arrow from Model 1's safe region to Model 2's safe region, labeled "Induced verification."
5. **Safe Regions**:
- Both models have purple boxes labeled "Safe ✓" with checkmarks, indicating verified safety.
### Detailed Analysis
- **Model 1**:
- Safe region is larger (red outline) compared to Model 2.
- Contains internal black arrows suggesting iterative or recursive processes.
- **Model 2**:
- Safe region is smaller and lacks the red outline, implying tighter but less forgiving safety constraints.
- **Error (ε)**:
- The dashed red line suggests an inherent approximation gap between the models, with bidirectional influence.
- **Verification Mechanisms**:
- **Direct Safety Verification**: Explicitly applied to Model 2.
- **Induced Verification**: Relies on Model 1's safety to infer Model 2's safety, introducing potential dependency on approximation error ε.
### Key Observations
1. **Safe Region Size Disparity**:
- Model 1's safe region is visually ~1.5× larger than Model 2's, suggesting broader but less precise safety guarantees.
2. **Error Propagation**:
- The bidirectional ε relationship implies that errors in Model 1's approximation directly affect Model 2's induced verification.
3. **Verification Reliability**:
- Model 2's safety is independently verified, while Model 1's relies on indirect inference, potentially increasing risk.
### Interpretation
The diagram underscores a critical trade-off in safety-critical systems:
- **Model 1** prioritizes coverage (larger safe region) at the cost of precision, making it suitable for conservative but less accurate applications.
- **Model 2** emphasizes precision (smaller safe region) with direct verification, ideal for high-stakes scenarios where errors are unacceptable.
- The **induced verification** pathway introduces a dependency chain: errors in Model 1's approximation (ε) could compromise Model 2's safety, highlighting the need for rigorous error bounds in cross-model validation.
This structure is common in formal verification of AI/ML systems, where model simplification (e.g., surrogate models) must balance safety and performance. The red color coding emphasizes critical error and verification pathways, while the checkmarks visually reinforce safety compliance.