\n
## Diagram: Model Relationship and Safety Verification
### Overview
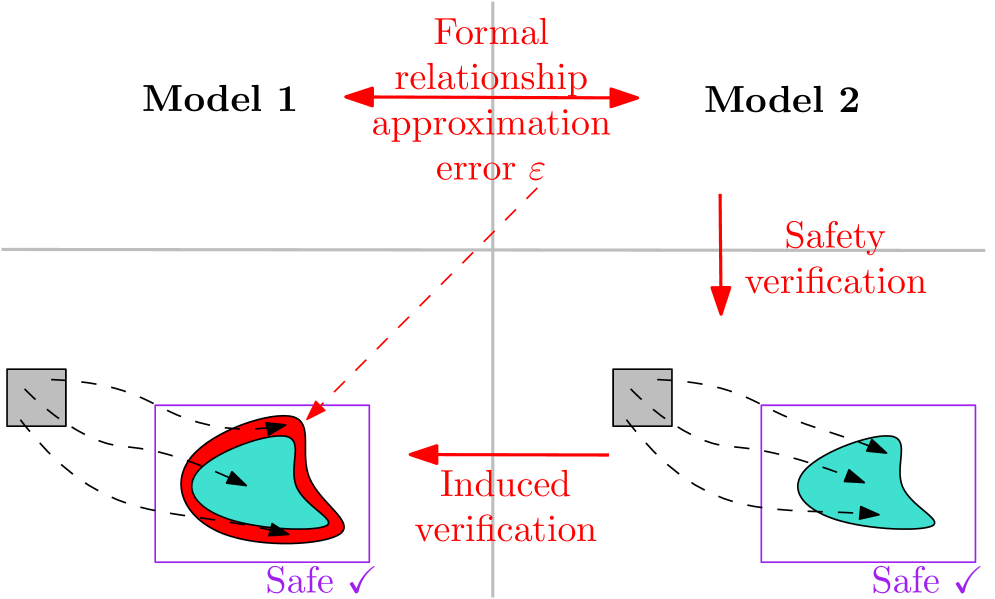
The image is a diagram illustrating the relationship between two models (Model 1 and Model 2) and the process of safety verification. It depicts how safety properties are transferred from one model to another, accounting for approximation errors. The diagram uses shapes and arrows to represent the flow of information and the verification process.
### Components/Axes
The diagram consists of the following components:
* **Model 1:** Located on the left side of the diagram.
* **Model 2:** Located on the right side of the diagram.
* **Horizontal Line:** Separates the models and the verification processes.
* **"Formal relationship approximation error ε":** A red, curved arrow pointing diagonally downwards from Model 1 to Model 2, indicating the error introduced during the approximation of the relationship between the models.
* **"Safety verification":** A red, vertical arrow pointing downwards from Model 2, representing the process of verifying safety properties in Model 2.
* **"Induced verification":** A red, horizontal arrow pointing from the lower left (Model 1's safety region) to the lower right (Model 2's safety region).
* **Safety Regions:** Two enclosed areas, one below each model, containing shapes representing safe states. Each region is marked with a green checkmark labeled "Safe".
* **Shapes within Safety Regions:** Irregular shapes (teal and red) within the safety regions, representing the set of safe states.
* **Dashed Lines:** Grey dashed lines surrounding the shapes within the safety regions, possibly representing boundaries or constraints.
* **Small Squares:** Small squares in the top-left and top-right corners of each model, possibly representing input or initial conditions.
### Detailed Analysis or Content Details
The diagram illustrates a process where safety is established in Model 1 and then transferred to Model 2.
* **Model 1:** Contains a teal and red shape enclosed within a safety region marked "Safe". The shape is surrounded by dashed lines.
* **Model 2:** Contains a teal shape enclosed within a safety region marked "Safe". The shape is surrounded by dashed lines.
* **Error Approximation:** The "Formal relationship approximation error ε" suggests that the transition from Model 1 to Model 2 introduces an error. This error is represented by the dashed arrow and the label "ε".
* **Induced Verification:** The "Induced verification" arrow indicates that the safety established in Model 1 induces a verification process in Model 2.
* **Safety Verification:** The "Safety verification" arrow indicates a direct verification process within Model 2.
### Key Observations
* The shapes within the safety regions are different between Model 1 and Model 2, suggesting that the approximation process alters the set of safe states.
* The presence of the error term "ε" highlights the importance of considering approximation errors when transferring safety properties between models.
* Both models ultimately achieve a "Safe" state, indicating that the verification process is successful despite the approximation error.
### Interpretation
This diagram demonstrates a formal method for verifying safety properties in a system modeled by two different representations (Model 1 and Model 2). The process acknowledges that the relationship between the models is not perfect and introduces an approximation error (ε). Despite this error, the diagram shows that safety can be induced from Model 1 to Model 2 through a verification process.
The diagram suggests a workflow where:
1. Safety is initially established in a more abstract or simplified model (Model 1).
2. The model is refined or approximated to a more concrete or detailed model (Model 2).
3. The approximation introduces an error (ε).
4. Safety is verified in the refined model (Model 2), taking into account the approximation error.
The use of shapes and regions likely represents state spaces or reachable sets of states. The "Safe" regions indicate the subset of states that satisfy the safety properties. The diagram is a high-level illustration of a formal verification technique, likely used in safety-critical systems where rigorous guarantees are required. The diagram does not provide specific numerical data, but rather a conceptual framework for safety verification.