## Line Chart: L0 Coefficient over Training Steps
### Overview
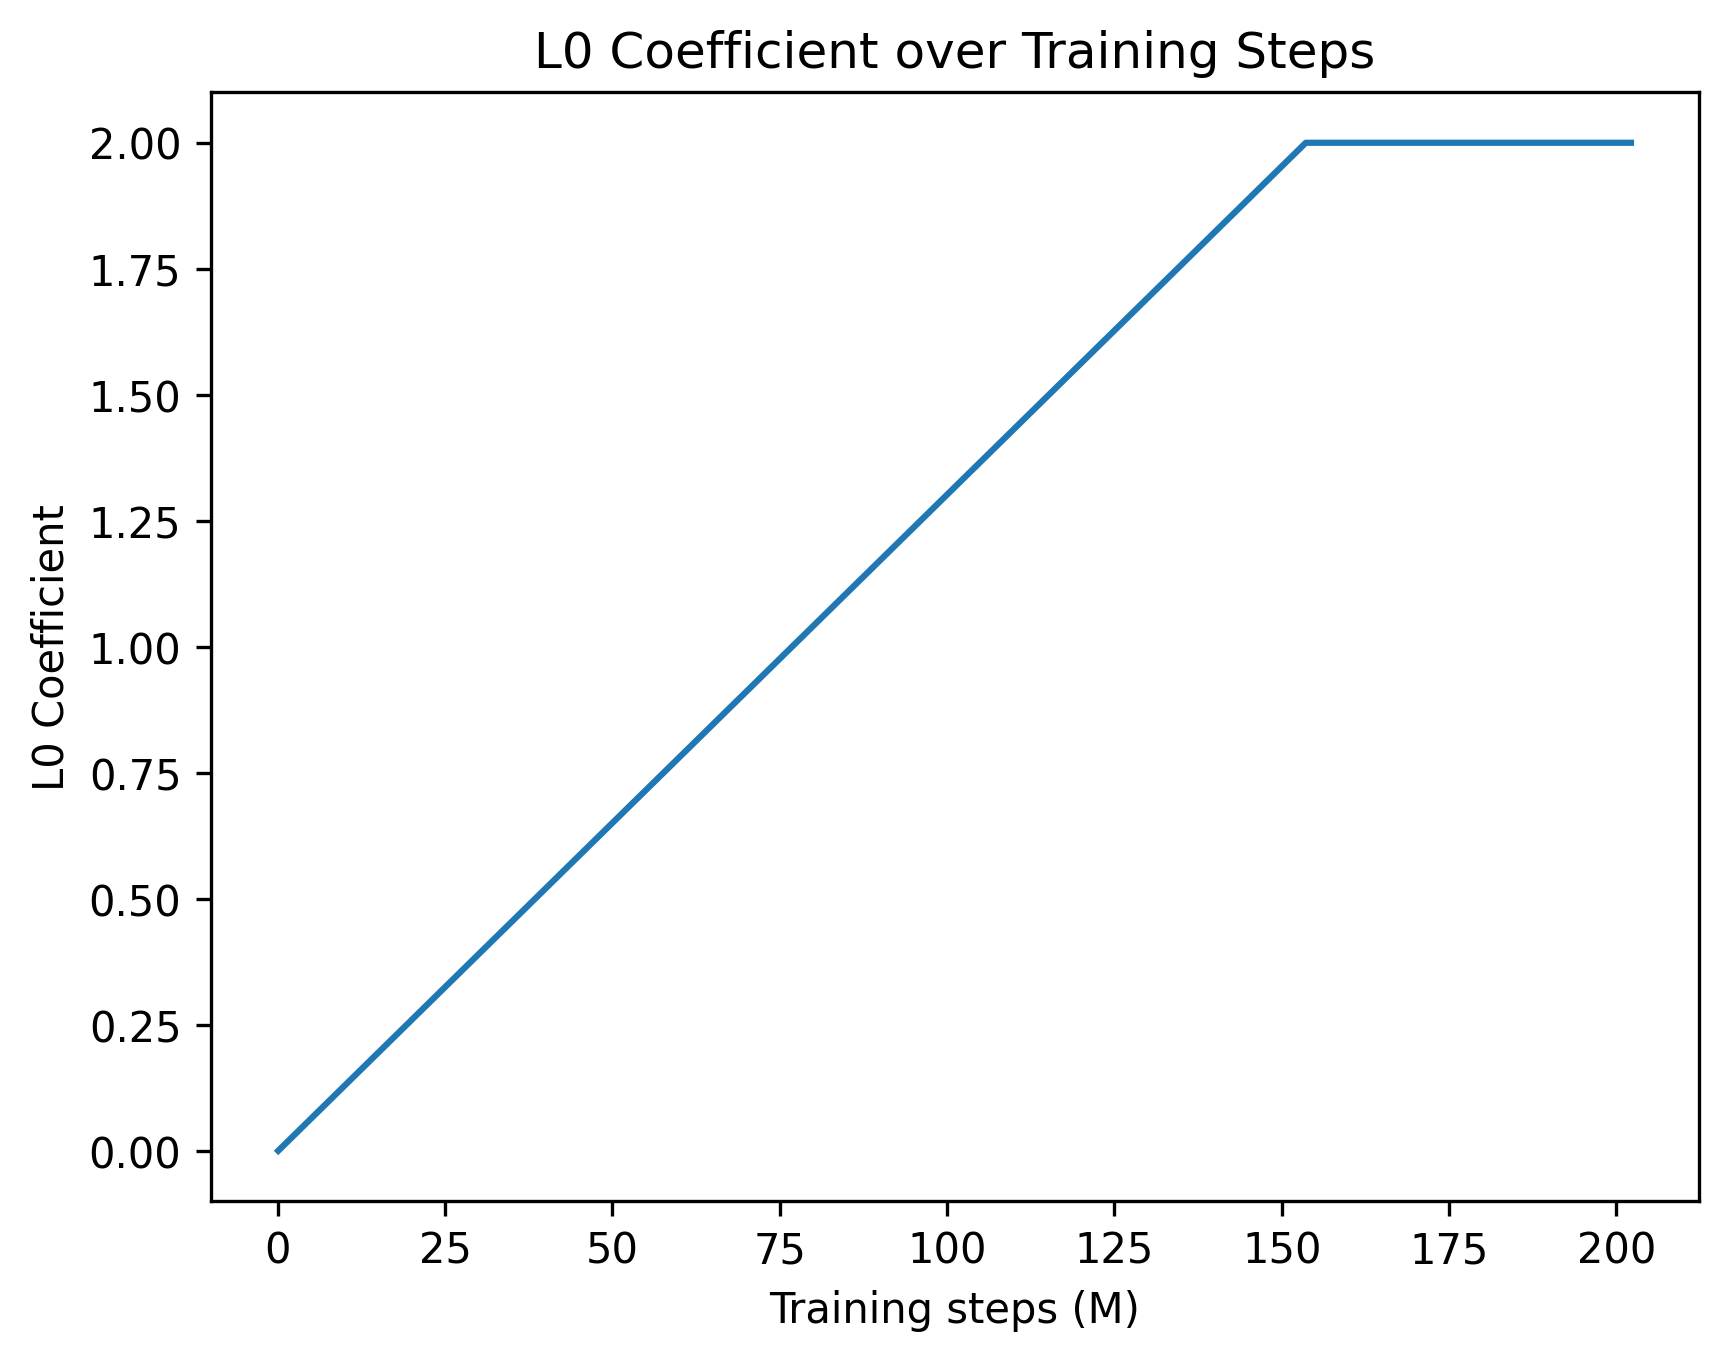
This image is a 2D line chart illustrating the scheduled progression of a hyperparameter, specifically the "L0 Coefficient," over the course of a machine learning model's training process. The chart displays a single data series characterized by a linear increase followed by a constant plateau.
### Components/Axes
**Header Region:**
* **Title:** "L0 Coefficient over Training Steps" (Positioned at the top center).
**Left Region (Y-Axis):**
* **Axis Title:** "L0 Coefficient" (Rotated 90 degrees counter-clockwise, positioned vertically along the left edge).
* **Scale:** Linear scale ranging from 0.00 to 2.00.
* **Major Markers:** 0.00, 0.25, 0.50, 0.75, 1.00, 1.25, 1.50, 1.75, 2.00.
**Bottom Region (X-Axis):**
* **Axis Title:** "Training steps (M)" (Positioned horizontally at the bottom center). The "(M)" likely denotes "Millions".
* **Scale:** Linear scale ranging from 0 to slightly past 200.
* **Major Markers:** 0, 25, 50, 75, 100, 125, 150, 175, 200.
**Main Chart Region:**
* **Data Series:** A single, solid blue line representing the coefficient's value.
* **Legend:** No legend is present, as there is only one data series.
### Detailed Analysis
**Trend Verification:**
The solid blue line begins at the origin in the bottom-left corner. It slopes upward in a strict, constant linear fashion (positive slope) across the majority of the chart. In the top-right quadrant, the slope abruptly changes to zero, forming a sharp corner, and the line continues perfectly horizontally to the right edge of the plot area.
**Data Extraction (Approximate Values):**
* **Start Point:** The line originates exactly at X = 0, Y = 0.00.
* **Mid-point Check:** At X = 75, the line is positioned just slightly below the Y = 1.00 mark (approximately Y ≈ 0.97), confirming the linear trajectory.
* **Inflection Point:** The linear increase halts when the line reaches Y = 2.00. Looking at the X-axis, this occurs slightly to the right of the 150 marker. Estimating the distance between 150 and 175, the inflection point sits at approximately **X ≈ 154** (± 2).
* **Plateau/End Point:** From X ≈ 154 onward, the line remains flat at Y = 2.00. The line terminates slightly past the final X-axis marker, at approximately **X ≈ 202**.
### Key Observations
* **Sharp Transition:** The transition from the linear growth phase to the plateau is a sharp angle, not a smooth asymptotic curve. This indicates a hard-coded programmatic threshold rather than an organic decay function.
* **Capped Value:** The maximum value of the L0 Coefficient is strictly capped at 2.00.
* **Duration:** The "warmup" or increasing phase takes up roughly 75% of the total plotted training time, with the plateau phase making up the remaining 25%.
### Interpretation
* **What the data suggests:** In the context of machine learning, an "L0 Coefficient" typically refers to the weight of an L0 regularization penalty. L0 regularization penalizes the absolute number of non-zero parameters in a model, encouraging sparsity (forcing weights to become exactly zero).
* **How the elements relate:** The chart depicts a "warmup schedule" for this penalty. At the beginning of training (0 steps), the penalty is 0, allowing the model to learn freely and utilize all its parameters to capture initial representations. As training progresses to ~154 million steps, the penalty is gradually and linearly introduced, slowly forcing the network to become sparse. Once the penalty reaches its maximum intended weight of 2.00, it is held constant for the remainder of the training run to fine-tune the now-sparse model.
* **Peircean/Investigative reading:** The use of "(M)" for millions of steps indicates a very large-scale training run, typical of Large Language Models (LLMs) or massive computer vision models. The specific choice to linearly scale the L0 penalty rather than applying it immediately suggests that applying strict sparsity constraints too early in training causes instability or prevents the model from converging effectively. The sharp inflection point implies a scheduling function likely written as `coefficient = min(current_step * slope, 2.0)`.