## Line Chart: L0 Coefficient over Training Steps
### Overview
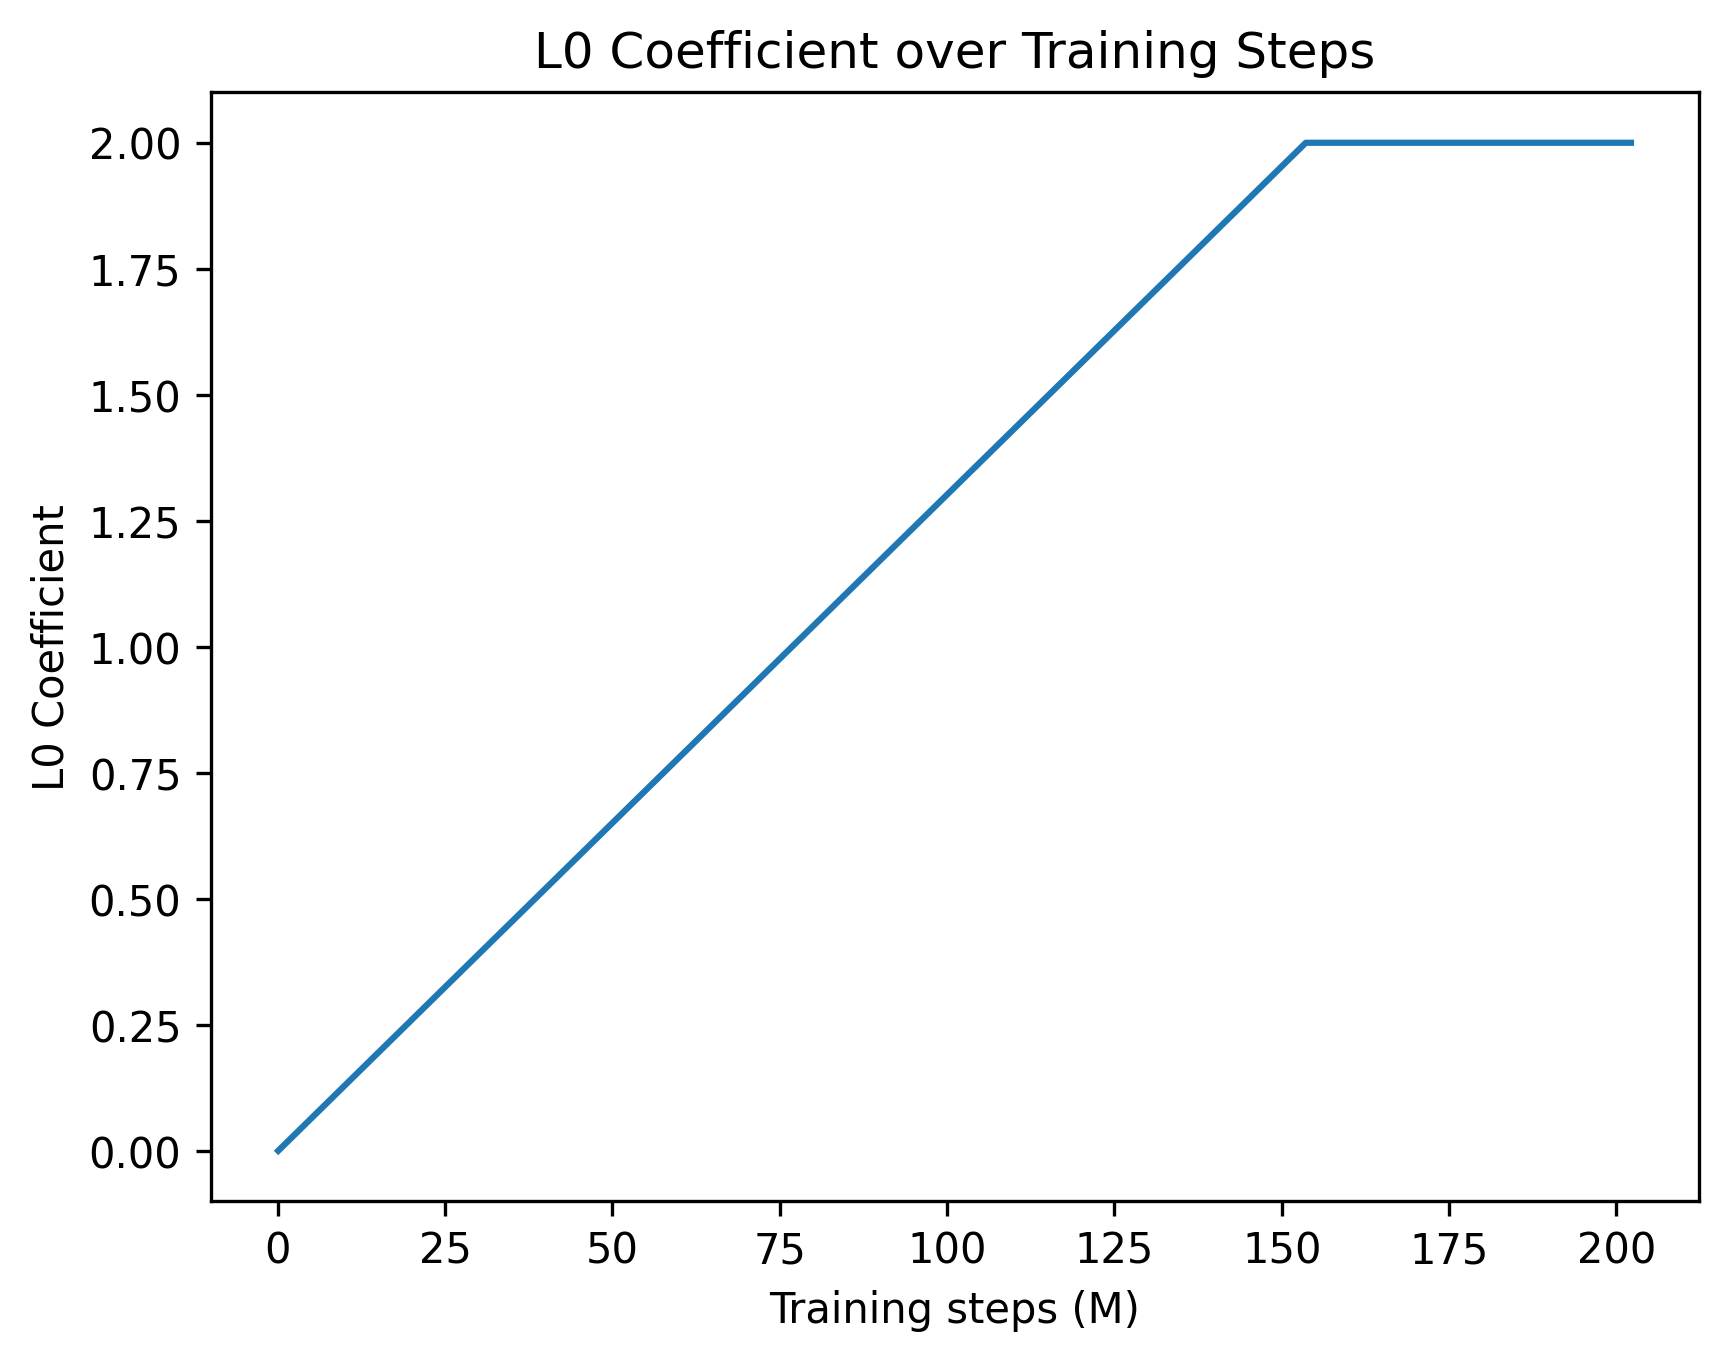
The image is a line chart showing the relationship between the L0 Coefficient and the number of Training Steps (M). The L0 Coefficient increases linearly with training steps until it plateaus at a value of 2.00.
### Components/Axes
* **Title:** L0 Coefficient over Training Steps
* **X-axis:** Training steps (M)
* Scale: 0 to 200, with tick marks at intervals of 25 (0, 25, 50, 75, 100, 125, 150, 175, 200)
* **Y-axis:** L0 Coefficient
* Scale: 0.00 to 2.00, with tick marks at intervals of 0.25 (0.00, 0.25, 0.50, 0.75, 1.00, 1.25, 1.50, 1.75, 2.00)
* **Data Series:** A single blue line representing the L0 Coefficient.
### Detailed Analysis
* **Data Series Trend:** The blue line starts at (0, 0.00). It increases linearly until approximately (150, 2.00). After this point, the line remains constant at 2.00 until (200, 2.00).
* **Data Points:**
* (0, 0.00)
* (25, 0.33) approximately
* (50, 0.66) approximately
* (75, 1.00)
* (100, 1.33) approximately
* (125, 1.66) approximately
* (150, 2.00)
* (175, 2.00)
* (200, 2.00)
### Key Observations
* The L0 Coefficient increases linearly with the number of training steps up to 150.
* After 150 training steps, the L0 Coefficient plateaus at a value of 2.00.
### Interpretation
The chart suggests that the L0 Coefficient increases during the initial training phase, indicating a change in the model's parameters. The plateau after 150 training steps suggests that the model has converged or reached a point where further training does not significantly affect the L0 Coefficient. The L0 coefficient is a measure of sparsity, so this graph suggests that the model becomes more sparse as training progresses, until it reaches a maximum sparsity at 150 training steps.