## Line Chart: L0 Coefficient over Training Steps
### Overview
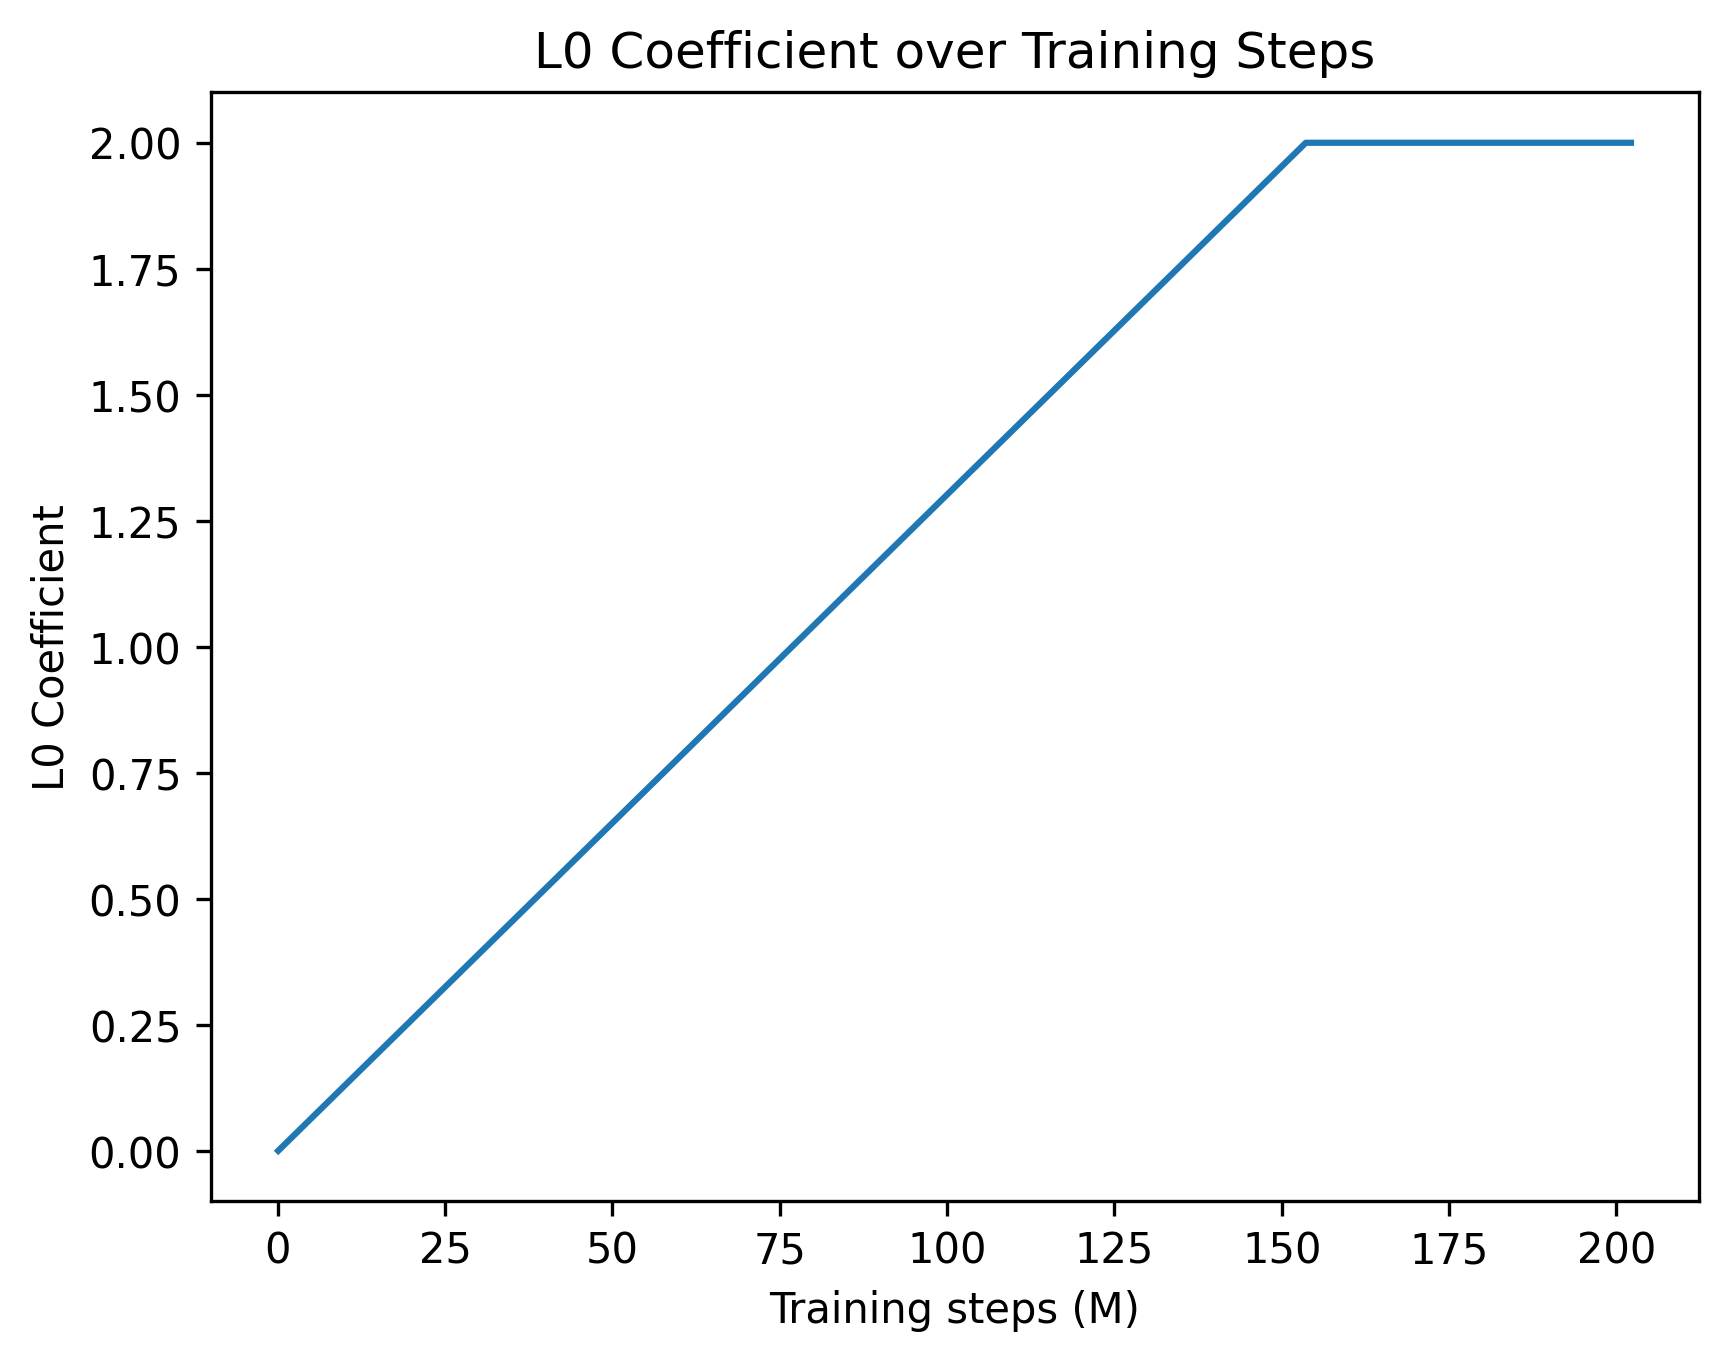
The image displays a simple line chart plotting the value of an "L0 Coefficient" against the number of training steps, measured in millions (M). The chart shows a single, continuous data series with a distinct two-phase trend: a steady linear increase followed by a plateau.
### Components/Axes
* **Chart Title:** "L0 Coefficient over Training Steps" (centered at the top).
* **Y-Axis (Vertical):**
* **Label:** "L0 Coefficient".
* **Scale:** Linear scale ranging from 0.00 to 2.00.
* **Major Tick Marks:** 0.00, 0.25, 0.50, 0.75, 1.00, 1.25, 1.50, 1.75, 2.00.
* **X-Axis (Horizontal):**
* **Label:** "Training steps (M)".
* **Scale:** Linear scale ranging from 0 to 200.
* **Major Tick Marks:** 0, 25, 50, 75, 100, 125, 150, 175, 200.
* **Data Series:** A single solid blue line. There is no legend, as only one series is present.
### Detailed Analysis
The data series follows a precise, piecewise linear path:
1. **Phase 1 - Linear Increase:**
* **Trend:** The line slopes upward at a constant rate from the origin.
* **Start Point:** (0 M steps, 0.00 coefficient).
* **End Point:** The line reaches its maximum value at approximately 150 M steps.
* **Slope Calculation:** The coefficient increases from 0.00 to 2.00 over 150 M steps, yielding an approximate slope of **0.0133 coefficient units per million steps** (2.00 / 150 M).
2. **Phase 2 - Plateau:**
* **Trend:** The line becomes perfectly horizontal, indicating a constant value.
* **Start Point:** (~150 M steps, 2.00 coefficient).
* **End Point:** The line continues at this constant value to the end of the plotted range at 200 M steps.
* **Value:** The L0 Coefficient is held fixed at **2.00** from step 150 M onward.
### Key Observations
* The transition from the increasing phase to the plateau phase is sharp and occurs at a single point (~150 M steps), not a gradual curve.
* The chart depicts a perfectly deterministic schedule, not noisy experimental data. The line is straight in both segments.
* The maximum value of the L0 Coefficient is 2.00, and the minimum is 0.00 within the observed window.
* The chart contains no gridlines, annotations, or additional data markers beyond the line itself.
### Interpretation
This chart illustrates a predefined **scheduling strategy** for a hyperparameter called the "L0 Coefficient" during a model training process. The L0 norm is often associated with promoting sparsity in machine learning models (e.g., in L0 regularization). The data suggests the following training protocol:
1. **Warm-up / Gradual Introduction:** For the first 150 million training steps, the strength of the L0-related constraint or penalty (the coefficient) is gradually and linearly increased from zero to its maximum value of 2.00. This allows the model to initially learn without the constraint, which is then slowly "turned on" to guide the optimization towards a desired property (like sparsity) without destabilizing early training.
2. **Stable Application:** After 150 million steps, the coefficient is fixed at 2.00 for the remainder of the training (at least until 200 M steps). This indicates the constraint has reached its full intended strength and is maintained to finalize the model's parameters under this fixed regularization regime.
The clear, piecewise linear nature of the plot indicates this is a planned schedule, not a measured outcome. It answers the question: "How was the L0 Coefficient varied over the course of training?" The answer is a controlled ramp-up followed by a constant hold.