## Line Graph: L0 Coefficient over Training Steps
### Overview
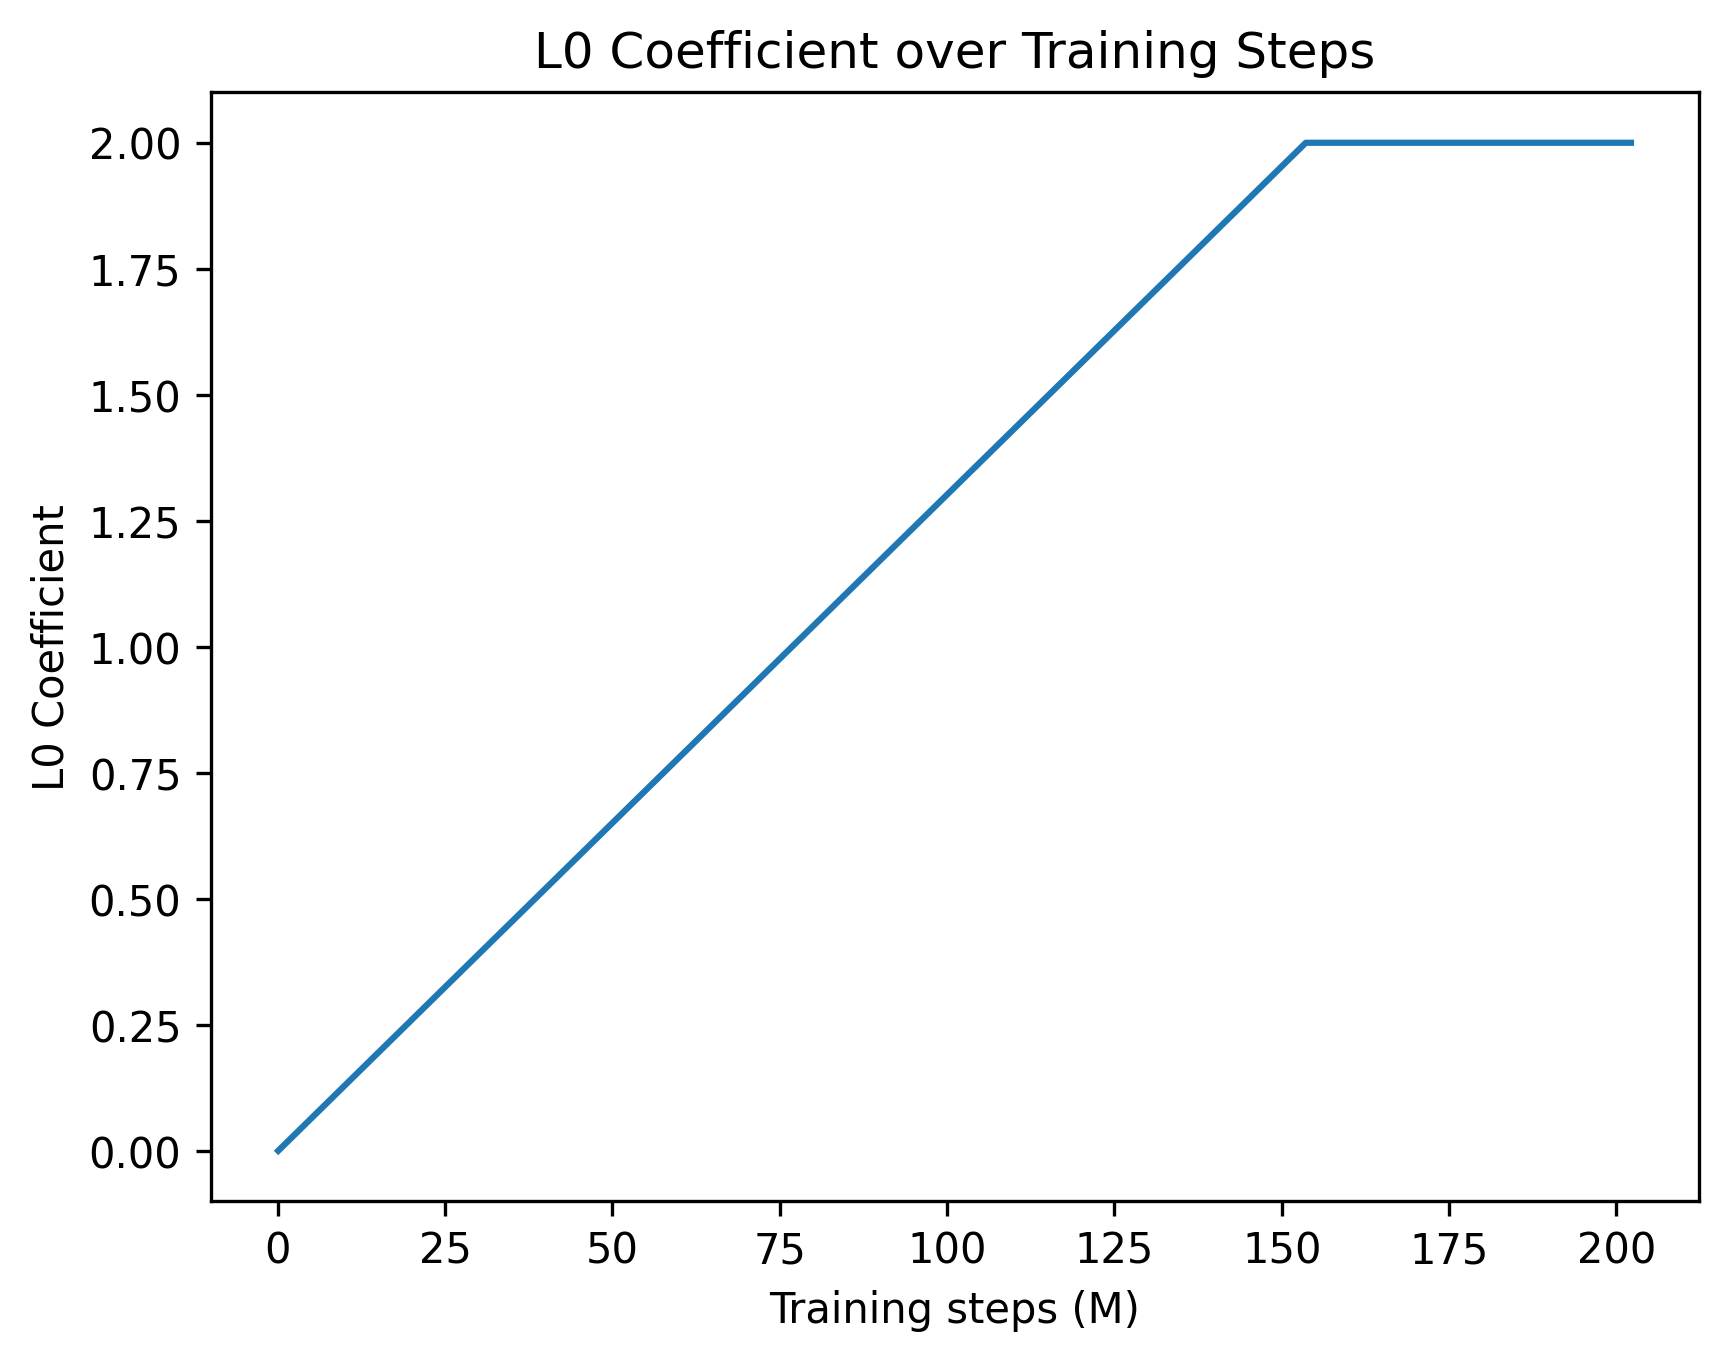
The image depicts a line graph illustrating the relationship between the L0 Coefficient and training steps (measured in millions). The graph shows a linear increase in the L0 Coefficient until approximately 150 million training steps, after which it plateaus at a constant value.
### Components/Axes
- **Title**: "L0 Coefficient over Training Steps" (centered at the top).
- **X-axis**: Labeled "Training steps (M)" with increments of 25 million (0, 25, 50, ..., 200). The axis spans from 0 to 200 million.
- **Y-axis**: Labeled "L0 Coefficient" with increments of 0.25 (0.00, 0.25, 0.50, ..., 2.00). The axis spans from 0 to 2.00.
- **Legend**: No legend is present in the image.
- **Line**: A single blue line represents the L0 Coefficient trend. It starts at the origin (0, 0) and increases linearly until ~150 million steps, then plateaus at 2.00.
### Detailed Analysis
- **Data Points**:
- At 0 million steps: L0 Coefficient = 0.00.
- At ~150 million steps: L0 Coefficient = 2.00.
- From 150 million to 200 million steps: L0 Coefficient remains constant at 2.00.
- **Trend**: The line exhibits a linear increase (slope ≈ 0.0133 per million steps) until 150 million steps, followed by a horizontal plateau.
### Key Observations
1. **Linear Growth Phase**: The L0 Coefficient increases steadily from 0 to 2.00 as training progresses.
2. **Plateau Phase**: After ~150 million steps, the coefficient stabilizes at 2.00, indicating no further change despite additional training.
3. **No Noise/Variability**: The line is perfectly straight, suggesting no experimental or computational noise in the data.
### Interpretation
The graph demonstrates that the L0 Coefficient grows linearly with training steps until a critical threshold (~150 million steps), after which it ceases to change. This behavior could imply:
- **Convergence**: The model or system being trained reaches a stable state where further training does not alter the L0 Coefficient.
- **Saturation Effect**: The coefficient may represent a parameter (e.g., learning rate, regularization strength) that becomes fixed once optimal performance is achieved.
- **Training Efficiency**: The plateau suggests diminishing returns beyond 150 million steps, highlighting the importance of monitoring such metrics to avoid unnecessary computational costs.
The absence of variability or noise in the data raises questions about the experimental setup (e.g., controlled conditions, idealized model). In real-world scenarios, such a perfectly linear relationship might be rare, warranting further investigation into data collection or model assumptions.