\n
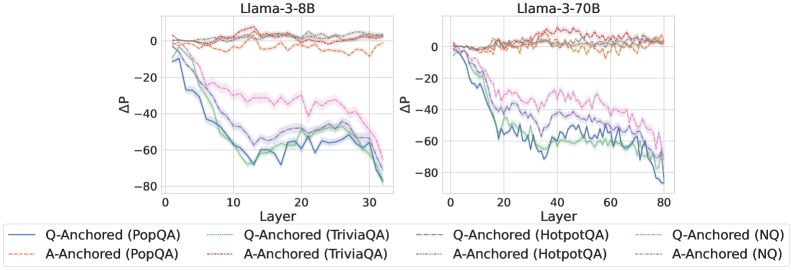
## Line Chart: ΔP vs. Layer for Llama-3 Models
### Overview
The image presents two line charts comparing the change in performance (ΔP) across different layers of two Llama-3 models: Llama-3-8B and Llama-3-70B. The charts display ΔP as a function of layer number, with different lines representing different question-answering datasets and anchoring methods.
### Components/Axes
* **X-axis:** Layer (ranging from 0 to 30 for Llama-3-8B and 0 to 80 for Llama-3-70B).
* **Y-axis:** ΔP (ranging from approximately -80 to 0).
* **Models:** Llama-3-8B (left chart), Llama-3-70B (right chart).
* **Datasets/Anchoring Methods (Legend):**
* Q-Anchored (PopQA) - Blue line
* A-Anchored (PopQA) - Light Orange dashed line
* Q-Anchored (TriviaQA) - Green line
* A-Anchored (TriviaQA) - Purple dashed line
* Q-Anchored (HotpotQA) - Light Blue line
* A-Anchored (HotpotQA) - Yellow dashed line
* Q-Anchored (NQ) - Teal line
* A-Anchored (NQ) - Red dashed line
* **Legend Position:** Bottom-center of each chart.
### Detailed Analysis or Content Details
**Llama-3-8B (Left Chart):**
* **Q-Anchored (PopQA):** Starts at approximately 0, rapidly declines to around -60 by layer 10, then plateaus around -60 to -70 from layer 15 to 30.
* **A-Anchored (PopQA):** Starts at approximately 0, declines more gradually to around -20 by layer 10, then plateaus around -20 to -30 from layer 15 to 30.
* **Q-Anchored (TriviaQA):** Starts at approximately 0, declines rapidly to around -50 by layer 10, then plateaus around -50 to -60 from layer 15 to 30.
* **A-Anchored (TriviaQA):** Starts at approximately 0, declines more gradually to around -30 by layer 10, then plateaus around -30 to -40 from layer 15 to 30.
* **Q-Anchored (HotpotQA):** Starts at approximately 0, declines rapidly to around -60 by layer 10, then plateaus around -60 to -70 from layer 15 to 30.
* **A-Anchored (HotpotQA):** Starts at approximately 0, declines more gradually to around -20 by layer 10, then plateaus around -20 to -30 from layer 15 to 30.
* **Q-Anchored (NQ):** Starts at approximately 0, declines rapidly to around -50 by layer 10, then plateaus around -50 to -60 from layer 15 to 30.
* **A-Anchored (NQ):** Starts at approximately 0, declines more gradually to around -30 by layer 10, then plateaus around -30 to -40 from layer 15 to 30.
**Llama-3-70B (Right Chart):**
* **Q-Anchored (PopQA):** Starts at approximately 0, rapidly declines to around -60 by layer 20, then plateaus around -60 to -70 from layer 40 to 80.
* **A-Anchored (PopQA):** Starts at approximately 0, declines more gradually to around -20 by layer 20, then plateaus around -20 to -30 from layer 40 to 80.
* **Q-Anchored (TriviaQA):** Starts at approximately 0, declines rapidly to around -50 by layer 20, then plateaus around -50 to -60 from layer 40 to 80.
* **A-Anchored (TriviaQA):** Starts at approximately 0, declines more gradually to around -30 by layer 20, then plateaus around -30 to -40 from layer 40 to 80.
* **Q-Anchored (HotpotQA):** Starts at approximately 0, declines rapidly to around -60 by layer 20, then plateaus around -60 to -70 from layer 40 to 80.
* **A-Anchored (HotpotQA):** Starts at approximately 0, declines more gradually to around -20 by layer 20, then plateaus around -20 to -30 from layer 40 to 80.
* **Q-Anchored (NQ):** Starts at approximately 0, declines rapidly to around -50 by layer 20, then plateaus around -50 to -60 from layer 40 to 80.
* **A-Anchored (NQ):** Starts at approximately 0, declines more gradually to around -30 by layer 20, then plateaus around -30 to -40 from layer 40 to 80.
### Key Observations
* In both models, Q-Anchored methods consistently show a larger drop in ΔP compared to A-Anchored methods.
* The decline in ΔP appears to stabilize after a certain layer number (around 15-20 for the 8B model and 40 for the 70B model).
* The 70B model exhibits a slower initial decline in ΔP compared to the 8B model, but the overall magnitude of the decline is similar.
* PopQA and HotpotQA datasets show the most significant drops in ΔP for Q-Anchored methods.
### Interpretation
The charts demonstrate how performance changes across layers in the Llama-3 models when evaluated on different question-answering datasets using different anchoring methods. The negative ΔP values indicate a decrease in performance as the layer number increases. The consistent difference between Q-Anchored and A-Anchored methods suggests that the method used to anchor the questions or answers significantly impacts performance, with Q-Anchoring generally leading to a more substantial performance drop.
The stabilization of ΔP after a certain layer suggests that the models reach a point where adding more layers does not significantly improve (or even degrades) performance on these datasets. The slower decline in the 70B model might indicate that larger models are more robust to the performance degradation associated with increasing layer depth.
The differences in performance across datasets (PopQA, TriviaQA, HotpotQA, NQ) highlight the sensitivity of the models to the specific characteristics of each dataset. The larger drops observed for PopQA and HotpotQA could indicate that these datasets are more challenging for the models, or that the models are more prone to overfitting on these datasets. The data suggests that the models' ability to generalize decreases with depth, and that the anchoring method plays a crucial role in mitigating this effect.