## Line Graph: Performance Comparison of Llama-3 Models Across Layers
### Overview
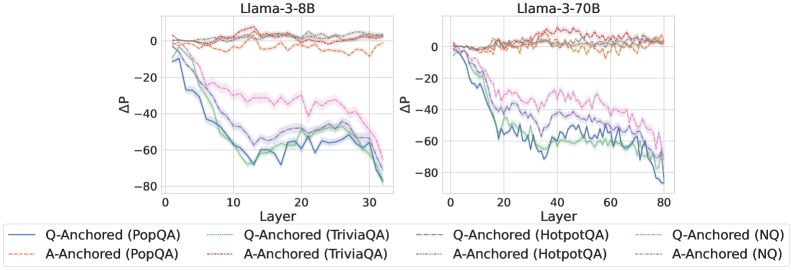
The image contains two side-by-side line graphs comparing the performance of different Llama-3 model configurations (8B and 70B) across layers. Each graph tracks the change in ΔP (likely a performance metric) across layers, with multiple data series representing different anchoring strategies and datasets.
### Components/Axes
- **X-axis**: Layer (0 to 30 for 8B, 0 to 80 for 70B)
- **Y-axis**: ΔP (ranging from -80 to 0)
- **Legends**:
- **Left Graph (Llama-3-8B)**:
- Blue: Q-Anchored (PopQA)
- Green: Q-Anchored (TriviaQA)
- Red: Q-Anchored (HotpotQA)
- Pink: Q-Anchored (NQ)
- Orange: A-Anchored (PopQA)
- Purple: A-Anchored (TriviaQA)
- Gray: A-Anchored (HotpotQA)
- Pink Dashed: A-Anchored (NQ)
- **Right Graph (Llama-3-70B)**:
- Same legend as above, with lines extending to 80 layers.
### Detailed Analysis
#### Llama-3-8B (Left Graph)
- **Q-Anchored (PopQA)**: Starts at 0, drops sharply to ~-60 by layer 20, then stabilizes with minor fluctuations.
- **Q-Anchored (TriviaQA)**: Begins at 0, declines to ~-40 by layer 20, then fluctuates between -30 and -50.
- **Q-Anchored (HotpotQA)**: Similar to TriviaQA but with more pronounced oscillations.
- **Q-Anchored (NQ)**: Remains near 0 with slight oscillations.
- **A-Anchored (PopQA)**: Starts at 0, drops to ~-40 by layer 20, then stabilizes.
- **A-Anchored (TriviaQA)**: Declines to ~-30 by layer 20, then fluctuates between -20 and -40.
- **A-Anchored (HotpotQA)**: Similar to TriviaQA but with more variability.
- **A-Anchored (NQ)**: Stays near 0 with minimal changes.
#### Llama-3-70B (Right Graph)
- **Q-Anchored (PopQA)**: Starts at 0, drops to ~-40 by layer 40, then stabilizes.
- **Q-Anchored (TriviaQA)**: Declines to ~-30 by layer 40, then fluctuates between -20 and -40.
- **Q-Anchored (HotpotQA)**: Similar to TriviaQA but with more pronounced oscillations.
- **Q-Anchored (NQ)**: Remains near 0 with slight oscillations.
- **A-Anchored (PopQA)**: Starts at 0, drops to ~-30 by layer 40, then stabilizes.
- **A-Anchored (TriviaQA)**: Declines to ~-20 by layer 40, then fluctuates between -10 and -30.
- **A-Anchored (HotpotQA)**: Similar to TriviaQA but with more variability.
- **A-Anchored (NQ)**: Stays near 0 with minimal changes.
### Key Observations
1. **Q-Anchored vs. A-Anchored**: Q-Anchored models generally show steeper declines in ΔP compared to A-Anchored models, especially in the 8B version.
2. **Dataset Impact**: PopQA and TriviaQA datasets exhibit more variability than NQ (No Query) models, which remain near 0.
3. **Model Size**: The 70B model shows more stability across layers compared to the 8B model, with less extreme ΔP values.
4. **Layer-Specific Trends**: In the 8B model, the sharpest drops occur in the first 20 layers, while the 70B model shows gradual changes.
### Interpretation
The data suggests that anchoring strategies (Q vs. A) significantly influence performance, with Q-Anchored models experiencing more pronounced declines in ΔP. The 70B model's larger size appears to mitigate these declines, resulting in more stable performance across layers. The NQ models (no anchoring) maintain near-zero ΔP, indicating baseline performance without optimization. The dataset-specific trends (e.g., PopQA vs. TriviaQA) highlight how different data types interact with anchoring methods, suggesting that model architecture and data characteristics jointly determine performance outcomes.