## Heatmap: Layer Importance vs. Parameter
### Overview
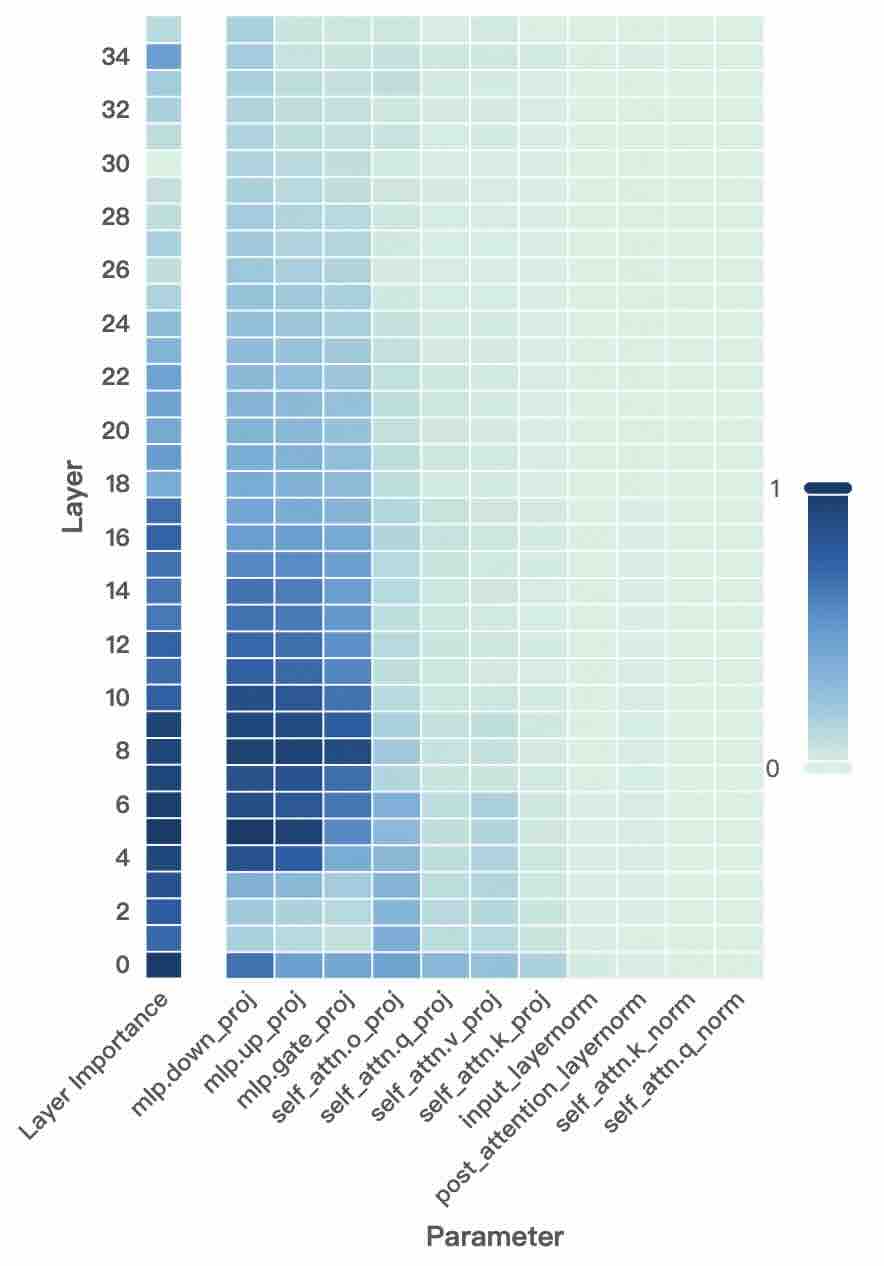
The image is a heatmap visualizing the importance of different layers (y-axis) with respect to various parameters (x-axis). The color intensity represents the degree of importance, ranging from light green (low importance, near 0) to dark blue (high importance, near 1).
### Components/Axes
* **Y-axis:** "Layer" with numerical labels from 0 to 34 in increments of 2. Also includes "Layer Importance" label.
* **X-axis:** "Parameter" with the following labels:
* mlp.down\_proj
* mlp.up\_proj
* mlp.gate\_proj
* self\_attn.o\_proj
* self\_attn.q\_proj
* self\_attn.v\_proj
* self\_attn.k\_proj
* input\_layernorm
* post\_attention\_layernorm
* self\_attn.k\_norm
* self\_attn.q\_norm
* **Color Legend:** Located on the right side of the heatmap. Dark blue corresponds to a value of 1, and light green corresponds to a value of 0. The color gradient represents intermediate values.
### Detailed Analysis
The heatmap shows the relative importance of each parameter for each layer.
* **Layer Importance:** The leftmost column shows the importance of each layer overall. The lower layers (approximately 2 to 16) appear to have higher importance (darker blue) compared to the upper layers (lighter blue/green).
* **mlp.down\_proj, mlp.up\_proj, mlp.gate\_proj:** These parameters show high importance (dark blue) for layers approximately 4 to 12. The importance decreases as the layer number increases.
* **self\_attn.o\_proj, self\_attn.q\_proj, self\_attn.v\_proj, self\_attn.k\_proj:** These parameters show moderate importance (various shades of blue) for layers approximately 2 to 20, with some variation in intensity.
* **input\_layernorm, post\_attention\_layernorm, self\_attn.k\_norm, self\_attn.q\_norm:** These parameters generally show low importance (light green) across all layers.
### Key Observations
* Lower layers (4-12) are more important for the "mlp" parameters.
* The "layernorm" parameters have consistently low importance across all layers.
* The layer importance is concentrated in the lower layers.
### Interpretation
The heatmap suggests that the lower layers of the model are more critical for the "mlp" parameters, indicating that these layers might be responsible for initial feature extraction or processing. The "layernorm" parameters, on the other hand, seem to have a less significant role in the model's performance, as indicated by their low importance across all layers. The overall layer importance is concentrated in the lower layers, which could mean that these layers are crucial for the model's learning process.