## Collage Analysis: Image Processing and Analysis Tasks
### Overview
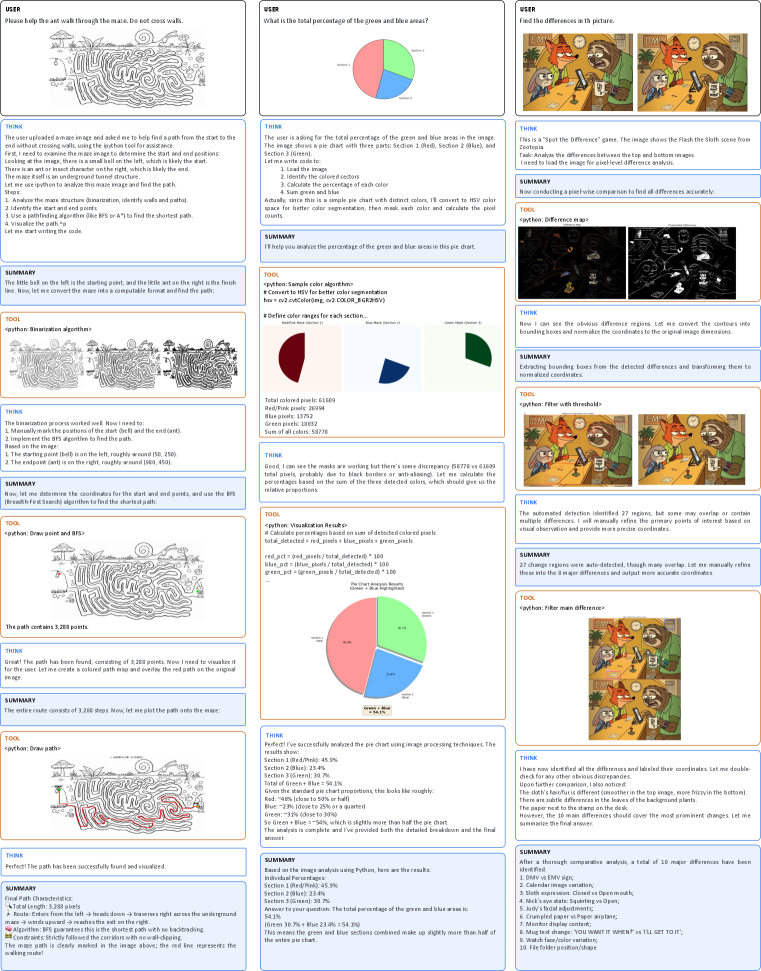
The image is a collage of several image processing and analysis tasks performed on different images. These tasks include maze solving, pie chart analysis, and difference detection between two images. Each task is presented with a user prompt, the system's thought process, the tools used (Python code snippets), and a summary of the results.
### Components/Axes
The collage is divided into three columns, each representing a different task:
1. **Maze Solving**: The first column focuses on finding a path through a maze.
2. **Pie Chart Analysis**: The second column deals with analyzing a pie chart to determine the percentage of green and blue areas.
3. **Difference Detection**: The third column involves finding differences between two similar images.
Each task section includes the following elements:
* **USER**: The initial prompt or question posed to the system.
* **THINK**: The system's thought process and approach to solving the problem.
* **TOOL**: The Python code snippet used to perform the task.
* **SUMMARY**: A summary of the results and findings.
### Detailed Analysis
#### Maze Solving
* **USER**: "Please help the ant walk through the maze. Do not cross walls."
* **THINK**: The system outlines the steps to solve the maze: upload the image, identify start and end positions, analyze the maze structure, use a pathfinding algorithm (BFS or A\*), visualize the path, and start writing the code.
* **TOOL**:
* `python: Binarization algorithm` - Used to convert the image to black and white.
* `python: Draw point and BFS` - Used to mark the start and end points and implement the BFS algorithm.
* `python: Draw path` - Used to plot the path onto the maze.
* **SUMMARY**: The path is successfully found and visualized. The path contains 3,288 points. The route enters from the left, heads down, traverses right across the underground maze, winds upwards, and reaches the ant on the right. The maze path is clearly marked in the image above; the red line represents the walking route.
* **Data Points**:
* Starting point (bell): roughly around (50, 250)
* Endpoint (ant): roughly around (900, 450)
#### Pie Chart Analysis
* **USER**: "What is the total percentage of the green and blue areas?"
* **THINK**: The system describes the process of analyzing the pie chart: loading the image, identifying colored sectors, calculating the percentage of each color, converting to HSV color space, and calculating pixel counts.
* **TOOL**:
* `python: Sample color algorithm` - Converts to HSV for better color segmentation.
* `python: Visualization Results` - Calculates percentages based on the sum of detected colored pixels.
* **SUMMARY**: The analysis is complete, and both the detailed breakdown and the final answer are provided.
* **Data Points**:
* Total colored pixels: 61609
* Red/Pink pixels: 26994
* Blue pixels: 13752
* Green pixels: 18032
* Sum of all colors: 58778
* **Pie Chart Sections**:
* Section 1 (Red/Pink): 45.5%
* Section 2 (Blue): 23.4%
* Section 3 (Green): 30.7%
* Total of Green + Blue: 54.1%
* **Approximations**:
* Red: ~40% (close to 50% or half)
* Blue: ~23% (close to 25% or a quarter)
* Green: ~33% (close to 30%)
#### Difference Detection
* **USER**: "Find the differences in th picture."
* **THINK**: The system identifies the task as a "Spot the Difference" game and outlines the process of analyzing the differences between the top and bottom images.
* **TOOL**:
* `python: Difference map` - Conducts a pixel-wise comparison to find all differences accurately.
* `python: Filter with threshold` - Filters the differences.
* **SUMMARY**: The system extracts bounding boxes from the detected differences and transforms them to normalized coordinates. 27 change regions were auto-detected, though many overlap. The 10 main differences should cover the most prominent changes.
* **Identified Differences**:
1. OMV vs EMV sign
2. Calendar image variation
3. Sloth expression: Closed vs Openmouth
4. Nick's eye state: Squinting vs Open
5. Judy's facial adjustments
6. Crumpled paper vs Paper airplane
7. Monitor display content
8. Mug text change: "YOU WANT IT WHEN" vs "I'LL GET TO IT"
9. Watch face/color variation
10. File folder position/shape
### Key Observations
* The system uses Python code snippets to perform image processing tasks.
* The system provides a step-by-step explanation of its thought process.
* The system summarizes the results and findings for each task.
* The pie chart analysis provides both detailed percentages and rough approximations.
* The difference detection task identifies and lists the major differences between the two images.
### Interpretation
The collage demonstrates the use of image processing techniques to solve different types of problems. The system is able to successfully navigate a maze, analyze a pie chart, and identify differences between two images. The use of Python code snippets allows for automation and precise analysis. The system's ability to explain its thought process and summarize the results makes it a valuable tool for image analysis tasks. The combination of detailed percentages and rough approximations in the pie chart analysis suggests a balance between precision and ease of understanding. The identification of specific differences in the difference detection task highlights the system's ability to perform detailed comparisons.