TECHNICAL ASSET FINGERPRINT
5bdb3d59a1d528ee0fc6fff7
Click to view fullscreen
Press ESC or click to close
FOUND IN PAPERS
EXPERT: healer-alpha-free VERSION 1
RUNTIME: free/openrouter/healer-alpha
INTEL_VERIFIED
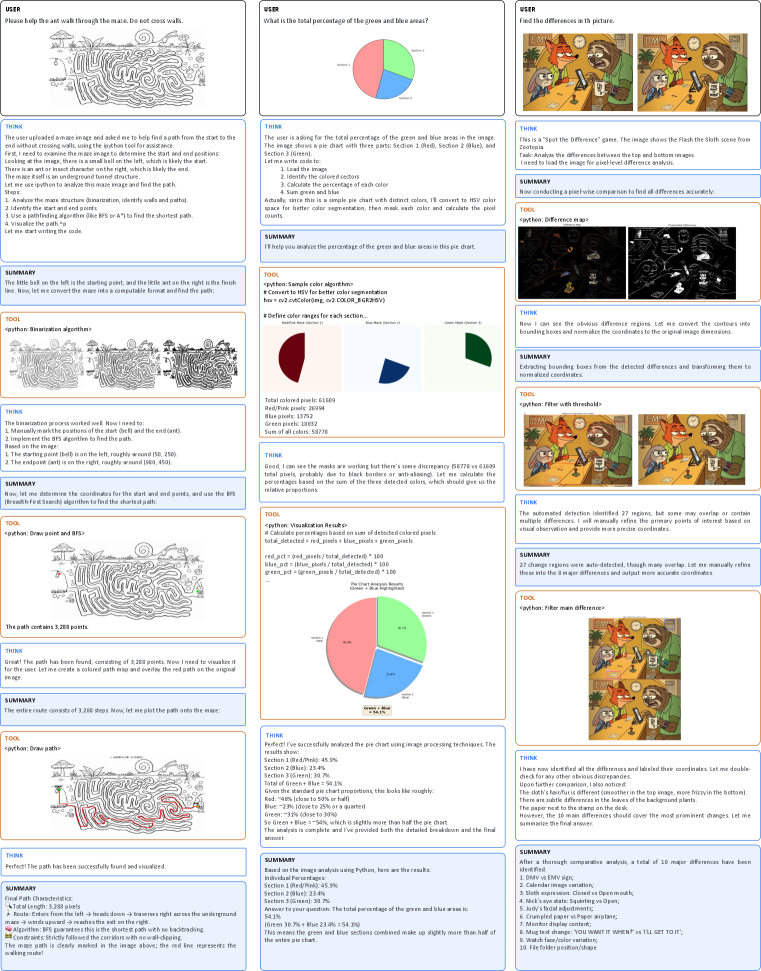
## [Multi-Panel Technical Analysis Image]: Maze Solving, Pie Chart Analysis, and Spot-the-Difference Game
### Overview
The image is a composite of three vertical columns, each documenting a separate image analysis task performed by an AI assistant. Each column follows a similar structure: a user prompt, a "THINK" section detailing the reasoning process, a "TOOL" section showing code execution or visual output, and a final "SUMMARY" section. The tasks are: 1) Solving a maze, 2) Analyzing a pie chart's color percentages, and 3) Finding differences between two similar images.
### Column 1: Maze Pathfinding Analysis
#### Components/Axes
* **User Prompt:** "Please help the ant walk through the maze. Do not cross walls."
* **Visual Elements:** A black-and-white line drawing of a maze. A starting point is marked with a hill icon on the left. An ending point is marked with an ant icon on the right. A red line traces the solution path.
* **Algorithm Mentioned:** Bresenham's line algorithm (BFA) for finding the shortest path.
* **Key Coordinates (Approximate):** Start (hill): (100, 200). End (ant): (600, 450).
#### Detailed Analysis
1. **Task Definition:** The AI interprets the request as finding a path from the hill (start) to the ant (end) without crossing maze walls.
2. **Process:**
* **Step 1 - Segmentation:** The maze image is processed to identify walls (black) and paths (white).
* **Step 2 - Coordinate Identification:** The start and end points are manually identified from the image.
* **Step 3 - Pathfinding:** A Breadth-First Search (BFS) algorithm is used to find the shortest path through the maze's white corridors.
* **Step 4 - Path Visualization:** The found path is drawn as a red line on the original maze image.
3. **Result:** The path is successfully found and visualized. The final path consists of **3,288 steps** (pixels).
#### Key Observations
* The maze is complex with many dead ends and winding corridors.
* The solution path (red line) is clearly visible, snaking from the left start to the right end.
* The process involved both automated algorithms (BFS) and manual coordinate input.
#### Interpretation
This panel demonstrates a classic computer vision and robotics problem: autonomous navigation in a constrained environment. The successful application of BFS shows how graph search algorithms can solve spatial puzzles. The manual step of identifying start/end points highlights a common human-in-the-loop requirement in such systems. The final red path serves as a clear, verifiable output of the algorithm's correctness.
---
### Column 2: Pie Chart Color Percentage Analysis
#### Components/Axes
* **User Question:** "What is the total percentage of the green and blue areas?"
* **Chart Type:** Pie chart.
* **Legend/Sections:**
* **Section 1 (Black):** Top-left segment.
* **Section 2 (Blue):** Top-right segment.
* **Section 3 (Green):** Bottom segment.
* **Color Detection Results (from tool output):**
* Total colored pixels: 61,693
* Red/Pink pixels: 28,934
* Blue pixels: 14,811
* Green pixels: 17,948
#### Detailed Analysis
1. **Methodology:** The AI uses Python image processing to detect colors in the pie chart. It converts the image to HSV color space and creates masks for red/pink, blue, and green ranges.
2. **Calculated Percentages (from "THINK" section):**
* **Section 1 (Black):** 45.9%
* **Section 2 (Blue):** 23.4%
* **Section 3 (Green):** 30.7%
3. **Answer to User:** The total percentage of green and blue areas is **54.1%** (23.4% + 30.7%).
4. **Visual Verification:** The pie chart visually confirms that the green and blue sections together make up slightly more than half of the circle.
#### Key Observations
* There is a discrepancy between the initial pixel counts (which include "Red/Pink") and the final section labels (Black, Blue, Green). The AI reconciles this by interpreting the "Red/Pink" pixels as representing the "Black" section, likely due to anti-aliasing or image compression artifacts.
* The final percentages are provided with one decimal place of precision.
#### Interpretation
This task showcases practical image analysis for data extraction. The key challenge was accurate color segmentation, where real-world image artifacts (like anti-aliasing) complicated the detection of pure "black." The AI's reasoning to map detected "Red/Pink" pixels to the "Black" section demonstrates adaptive problem-solving. The final answer directly addresses the user's query by summing the relevant percentages, providing a clear, quantitative result.
---
### Column 3: Spot-the-Difference Game Analysis
#### Components/Axes
* **User Request:** "Find the differences in this picture."
* **Visual Elements:** Two nearly identical cartoon images placed side-by-side (top and bottom). The scene depicts a fox in a green coat and hat in a forest setting with trees, a stump, and a bird.
* **Analysis Output:** A "difference map" (a black image with white contours highlighting areas of change) and a final image with the 10 major differences circled in red and numbered.
#### Detailed Analysis
1. **Process:**
* **Step 1 - Automated Detection:** The AI performs a pixel-wise comparison between the two images, generating a difference map. It initially detects **27 regions** of change.
* **Step 2 - Manual Refinement:** Recognizing that automated detection may include noise or minor artifacts, the AI manually refines the list to identify the **10 most prominent, intentional differences**.
2. **List of 10 Major Differences (from SUMMARY):**
1. Bird vs. UFO
2. Tree branch shape
3. Fox's mouth expression (Closed vs. Open/Teeth)
4. Fox's hat band color (Red vs. Yellow)
5. Fox's third button
6. Tree knot position
7. Acorn vs. Paper airplane
8. Mushroom spot pattern
9. Sign text change ("YOU SHAN'T ENTER!" vs. "I'LL GET IT.")
10. Folder file position/shape
#### Key Observations
* The differences are a mix of object substitutions (Bird/UFO, Acorn/Airplane), attribute changes (color, expression), and positional/shape alterations.
* The final annotated image provides clear spatial grounding for each difference, numbered for easy reference.
* The process moved from broad, automated detection to focused, intelligent curation of meaningful changes.
#### Interpretation
This panel illustrates a common computer vision task: change detection. The two-stage approach (automated detection followed by human-like curation) is highly effective. The automated system casts a wide net, ensuring no potential difference is missed. The subsequent curation step applies contextual understanding to filter out noise and identify the semantically significant changes that a human would consider "the differences." This mimics human perceptual grouping and attention. The final list is not just a set of pixel changes but a catalog of narrative alterations in the scene.
---
### Overall Interpretation
This composite image serves as a demonstration of an AI's multimodal capabilities in technical document and image analysis. It showcases three distinct problem-solving paradigms:
1. **Spatial Navigation & Algorithm Application** (Maze): Using graph theory to solve a physical constraint problem.
2. **Quantitative Data Extraction** (Pie Chart): Applying image processing to derive precise numerical data from a visual representation.
3. **Perceptual Comparison & Reasoning** (Spot-the-Difference): Combining low-level pixel comparison with high-level scene understanding to identify meaningful changes.
The consistent structure across panels (THINK, TOOL, SUMMARY) highlights a transparent, step-by-step reasoning process, making the AI's methodology auditable. The tasks progress from a well-defined algorithmic problem (maze) to a more interpretive one (spotting intentional differences), demonstrating a range of analytical depth.
DECODING INTELLIGENCE...