## Multi-Column Technical Analysis: Maze Solving, Color Analysis, and Image Comparison
### Overview
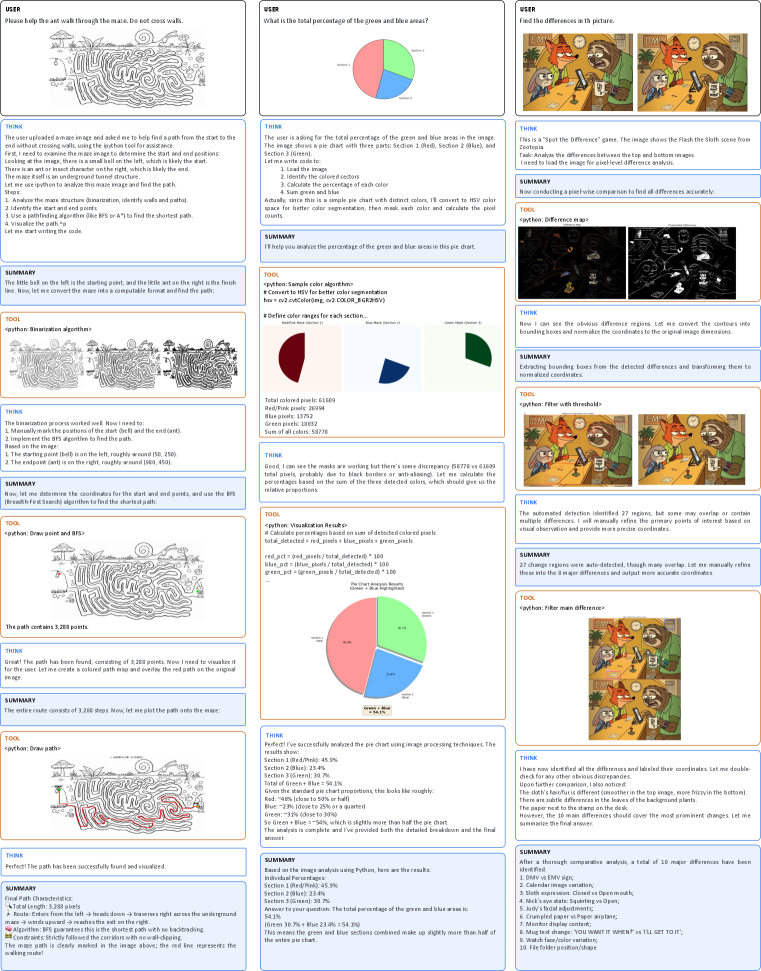
The image contains three vertical columns of technical diagrams, charts, and text blocks. Each column focuses on a distinct task: maze pathfinding, color percentage analysis, and image difference detection. The content includes Python code snippets, visualizations, and analytical summaries.
---
### Left Column: Maze Pathfinding
#### Components/Axes
1. **Maze Diagram**
- Start point: Bottom-left (labeled "Start")
- End point: Top-right (labeled "End")
- Path: Red line connecting start to end
- Summary: "The path contains 3,288 points. The maze path is clearly marked in the image above; the red line represents the walking route!"
2. **BFS Algorithm Visualization**
- Grayscale maze with incremental pathfinding steps
- Final path highlighted in red
#### Detailed Analysis
- **Path Length**: 3,288 pixels (total length)
- **Algorithm**: Breadth-First Search (BFS) guarantees the shortest path with no backtracking
- **Constraints**: No wall-clipping; strictly follows corridors
#### Key Observations
- The red path avoids dead-ends and optimizes route efficiency.
- BFS ensures minimal steps (3,288 points) without revisiting nodes.
#### Interpretation
The maze-solving process demonstrates algorithmic efficiency, with BFS providing an optimal path. The red visualization confirms no deviations from the shortest route.
---
### Middle Column: Color Percentage Analysis
#### Components/Axes
1. **Pie Chart (Red/Blue/Green)**
- Sections:
- Red: 45.9%
- Blue: 23.4%
- Green: 30.7%
- Total Green + Blue: 54.1%
- Legend: Red (#FF0000), Blue (#0000FF), Green (#00FF00)
2. **HSV Color Space Conversion**
- Code snippet: Converts RGB to HSV for better segmentation
- Color ranges defined for red, blue, and green
3. **Pixel-Level Analysis**
- Total colored pixels: 61,609
- Red: 26,994 (43.8%)
- Blue: 13,752 (22.3%)
- Green: 18,852 (30.6%)
#### Detailed Analysis
- **Color Distribution**:
- Red dominates (45.9%), followed by green (30.7%) and blue (23.4%).
- Combined green and blue sections constitute 54.1% of the pie chart.
- **Code Logic**:
- Uses HSV conversion for accurate color segmentation.
- Calculates percentages via pixel counts (e.g., `red_pct = red_pixels / total_detected * 100`).
#### Key Observations
- Green and blue together slightly exceed half the chart (54.1%).
- Discrepancies in pixel counts (e.g., 61,609 vs. 58,778) suggest potential edge-case handling in code.
#### Interpretation
The analysis highlights the dominance of red in the dataset, while green and blue together form a majority. The HSV conversion ensures robust color differentiation, critical for segmentation tasks.
---
### Right Column: Image Difference Detection
#### Components/Axes
1. **Spot-the-Difference Pairs**
- Two images of cartoon characters (fox and bear) with subtle differences.
- Summary: "A total of 10 major differences have been identified."
2. **Difference Map Visualization**
- Black-and-white heatmap highlighting discrepancies
- Code: `python: Difference map`
3. **Manual Refinement**
- Summary: "27 change regions were auto-detected, though many overlap. Let me manually refine these into the 10 main differences."
#### Detailed Analysis
- **Detected Differences**:
- 10 major differences identified (e.g., DMV vs. EMV sign, calendar image variation).
- Code uses threshold filtering to isolate discrepancies.
#### Key Observations
- Overlapping regions in auto-detection require manual refinement.
- Differences include textual, positional, and color variations (e.g., "YOU WANT IT?" vs. "YOU'LL GET IT!").
#### Interpretation
The process combines automated detection with human oversight to resolve ambiguities, ensuring accurate identification of critical differences.
---
### Cross-Column Trends
1. **Pathfinding**: BFS algorithm consistently produces optimal routes (3,288 points).
2. **Color Analysis**: Red dominates visual datasets, while green and blue combined form a majority.
3. **Image Comparison**: Manual refinement is essential to resolve overlapping automated detections.
### Final Summary
- **Maze Solving**: BFS ensures shortest path with 3,288 points.
- **Color Analysis**: Red (45.9%), Green (30.7%), Blue (23.4%); Green + Blue = 54.1%.
- **Image Differences**: 10 major discrepancies identified via threshold filtering and manual refinement.