## Chart Compilation: Prostate Cancer Data Analysis
### Overview
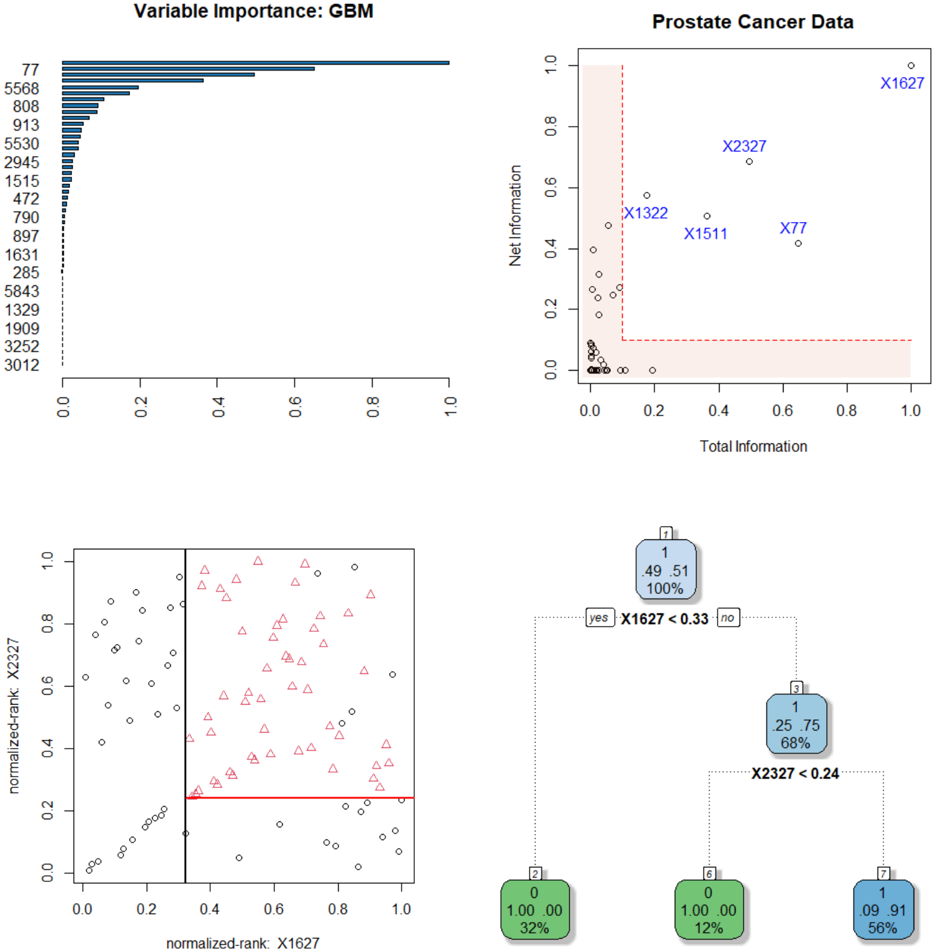
The image presents a compilation of four charts related to prostate cancer data analysis. These charts include a variable importance plot, a scatter plot of total vs. net information, a scatter plot of normalized ranks, and a decision tree.
### Components/Axes
**1. Variable Importance: GBM (Top-Left)**
* **Title:** Variable Importance: GBM
* **Y-axis:** List of numerical values (77, 5568, 808, 913, 5530, 2945, 1515, 472, 790, 897, 1631, 285, 5843, 1329, 1909, 3252, 3012). These represent variable names or IDs.
* **X-axis:** Ranges from 0.0 to 1.0, representing the importance score.
**2. Prostate Cancer Data (Top-Right)**
* **Title:** Prostate Cancer Data
* **X-axis:** Total Information, ranging from 0.0 to 1.0.
* **Y-axis:** Net Information, ranging from 0.0 to 1.0.
* **Data Points:** Scatter plot with several points labeled: X1627 (at approximately (0.95, 0.95)), X2327 (at approximately (0.4, 0.7)), X1322 (at approximately (0.15, 0.5)), X1511 (at approximately (0.4, 0.45)), X77 (at approximately (0.6, 0.4)).
* **Highlighted Region:** A shaded red region in the bottom-left corner, bounded by x=0.2 and y=0.1.
**3. Normalized-Rank Scatter Plot (Bottom-Left)**
* **X-axis:** normalized-rank: X1627, ranging from 0.0 to 1.0.
* **Y-axis:** normalized-rank: X2327, ranging from 0.0 to 1.0.
* **Data Points:** Scatter plot with two types of points: circles and red triangles.
* **Lines:** A vertical black line at x=0.35 and a horizontal red line at y=0.25.
**4. Decision Tree (Bottom-Right)**
* **Nodes:** The tree consists of several nodes, each containing information.
* **Root Node:** Top node labeled "1" with values 0.49 and 0.51, and 100%.
* **Decision Rule:** "X1627 < 0.33".
* **Branches:** Two branches labeled "yes" and "no".
* **Child Nodes:**
* Left child node labeled "2" with values 1.00 and 0.00, and 32%.
* Right child node labeled "3" with values 0.25 and 0.75, and 68%.
* **Second Decision Rule:** "X2327 < 0.24" from node 3.
* **Grandchild Nodes:**
* From node 3, left child node labeled "6" with values 1.00 and 0.00, and 12%.
* From node 3, right child node labeled "7" with values 0.09 and 0.91, and 56%.
### Detailed Analysis
**1. Variable Importance: GBM**
* The variable with ID 77 has the highest importance score, close to 1.0.
* The importance scores decrease rapidly for the other variables.
* Variables 5568, 808, 913, and 5530 have relatively high importance scores compared to the rest.
* Variables 1329, 1909, 3252, and 3012 have the lowest importance scores, close to 0.0.
**2. Prostate Cancer Data**
* The majority of data points are clustered near the origin (0.0, 0.0).
* X1627 is an outlier with high total and net information.
* X2327, X1322, X1511, and X77 have moderate total and net information.
* The shaded red region highlights a zone of low total and net information.
**3. Normalized-Rank Scatter Plot**
* The plot shows the relationship between the normalized ranks of X1627 and X2327.
* The red triangles are clustered in the top-right quadrant, indicating high ranks for both variables.
* The circles are more scattered, with a concentration in the bottom-left quadrant.
* The vertical and horizontal lines divide the plot into four regions.
**4. Decision Tree**
* The decision tree uses X1627 and X2327 to classify the data.
* The first split is based on X1627 < 0.33.
* The second split is based on X2327 < 0.24.
* The tree predicts different outcomes based on these splits.
### Key Observations
* Variable 77 is the most important variable according to the GBM model.
* X1627 is an outlier in terms of total and net information.
* The normalized ranks of X1627 and X2327 are correlated for some data points.
* The decision tree provides a simple classification model based on X1627 and X2327.
### Interpretation
The compilation of charts provides a multi-faceted analysis of prostate cancer data. The variable importance plot identifies key variables, while the scatter plot visualizes the relationship between total and net information. The normalized-rank scatter plot explores the correlation between X1627 and X2327, and the decision tree offers a classification model based on these variables. The outlier X1627 and the importance of variable 77 are notable findings. The decision tree suggests that X1627 and X2327 are useful features for classifying the data, and the splits are based on thresholds of 0.33 and 0.24, respectively. The shaded region in the "Prostate Cancer Data" plot likely represents a region of low information content, potentially indicating less informative or less relevant data points.