TECHNICAL ASSET FINGERPRINT
5be1df2f3e94948989fe1ad6
Click to view fullscreen
Press ESC or click to close
FOUND IN PAPERS
EXPERT: healer-alpha-free VERSION 1
RUNTIME: free/openrouter/healer-alpha
INTEL_VERIFIED
\n
## Multi-Panel Technical Analysis: Prostate Cancer Data Modeling
### Overview
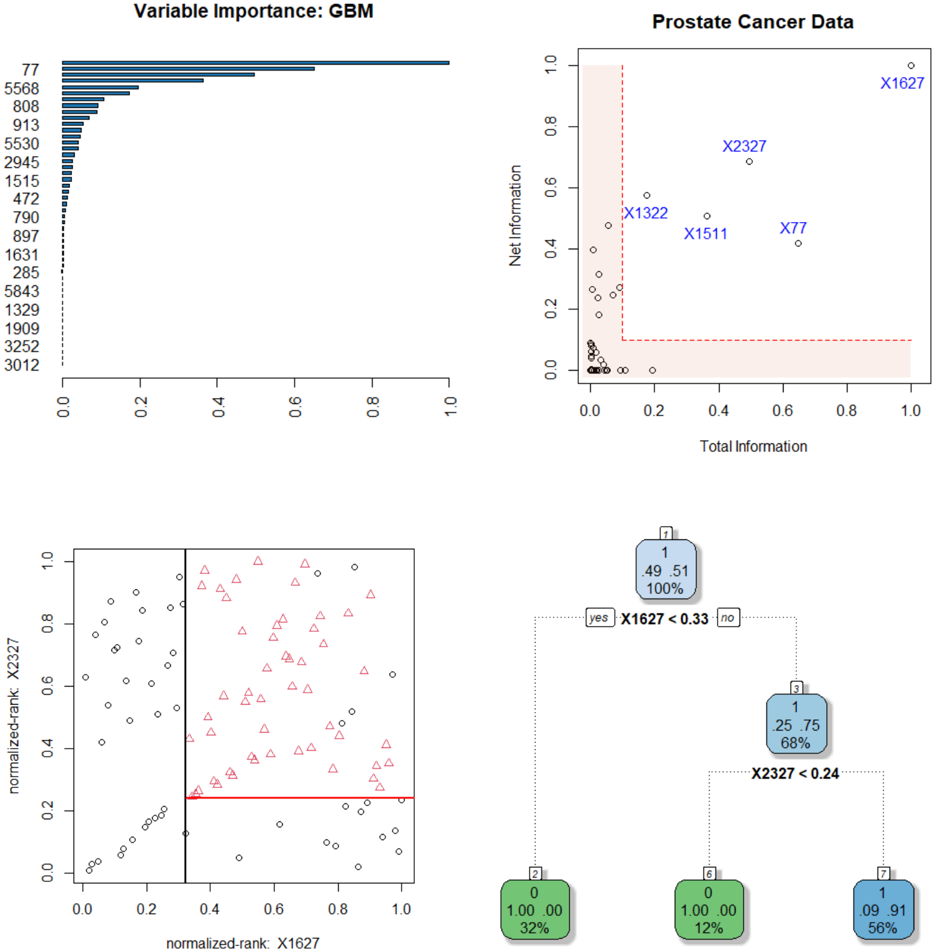
The image is a composite of four distinct technical plots related to a machine learning analysis of prostate cancer data. The panels collectively illustrate variable importance, information metrics, feature relationships, and a decision tree model. The overall theme is the interpretation and modeling of a dataset, likely for classification or prediction tasks.
### Components/Axes
The image is divided into four quadrants:
1. **Top-Left:** A horizontal bar chart titled "Variable Importance: GBM".
2. **Top-Right:** A scatter plot titled "Prostate Cancer Data".
3. **Bottom-Left:** A scatter plot with normalized rank axes.
4. **Bottom-Right:** A decision tree diagram.
### Detailed Analysis
#### 1. Top-Left: Variable Importance: GBM
* **Type:** Horizontal bar chart.
* **Title:** "Variable Importance: GBM" (GBM likely stands for Gradient Boosting Machine).
* **Y-axis (Vertical):** Lists variable identifiers. From top to bottom: `77`, `5568`, `808`, `913`, `5530`, `2945`, `1515`, `472`, `790`, `897`, `1631`, `285`, `5843`, `1329`, `1909`, `3252`, `3012`.
* **X-axis (Horizontal):** Represents importance score, scaled from 0.0 to 1.0.
* **Data:** The bars show a clear hierarchy. Variable `77` has the highest importance, with a bar extending to approximately 0.95. The next most important is `5568` (~0.65), followed by `808` (~0.55). Importance drops off rapidly after the top few variables. The bottom several variables (e.g., `3252`, `3012`) have near-zero importance.
#### 2. Top-Right: Prostate Cancer Data
* **Type:** Scatter plot.
* **Title:** "Prostate Cancer Data".
* **X-axis:** "Total Information", scaled from 0.0 to 1.0.
* **Y-axis:** "Net Information", scaled from 0.0 to 1.0.
* **Data Points:** Numerous small circles represent data points. Most are clustered in the lower-left corner (low Total and Net Information).
* **Labeled Points:** Five specific points are labeled with blue text:
* `X1627`: Located at approximately (1.0, 0.95) – the highest in both Total and Net Information.
* `X2327`: Located at approximately (0.5, 0.7).
* `X1322`: Located at approximately (0.2, 0.55).
* `X1511`: Located at approximately (0.4, 0.5).
* `X77`: Located at approximately (0.65, 0.45).
* **Annotations:** A red dashed line forms an "L" shape, creating a shaded region in the bottom-left corner (Total Information < ~0.1 and Net Information < ~0.1). This likely highlights a region of low-information variables.
#### 3. Bottom-Left: Normalized Rank Scatter Plot
* **Type:** Scatter plot with two distinct marker types.
* **X-axis:** "normalized-rank: X1627", scaled from 0.0 to 1.0.
* **Y-axis:** "normalized-rank: X2327", scaled from 0.0 to 1.0.
* **Data Series:**
* **Black Circles:** Scattered throughout the plot, but with a denser cluster in the lower-left quadrant (both ranks low).
* **Red Triangles:** Primarily located in the upper-right quadrant (both ranks high).
* **Decision Boundaries:**
* A **vertical black line** at X1627 rank ≈ 0.33.
* A **horizontal red line** at X2327 rank ≈ 0.24.
* These lines partition the space into four quadrants. The red triangles are almost exclusively found in the quadrant where X1627 rank > 0.33 **and** X2327 rank > 0.24.
#### 4. Bottom-Right: Decision Tree
* **Type:** Decision tree diagram.
* **Root Node (Node 1):** Blue box. Contains: `1`, `.49 .51`, `100%`. This indicates a split on class 1, with class probabilities of 49% and 51%, representing 100% of the data.
* **First Split:** Condition `X1627 < 0.33`. The "yes" branch goes left, the "no" branch goes right.
* **Left Child (Node 2):** Green box. Contains: `0`, `1.00 0.00`, `32%`. This is a leaf node predicting class 0 with 100% probability, covering 32% of the data.
* **Right Child (Node 3):** Blue box. Contains: `1`, `.25 .75`, `68%`. This is an internal node for class 1, with probabilities 25%/75%, covering 68% of the data.
* **Second Split (from Node 3):** Condition `X2327 < 0.24`.
* **Leaf Nodes from Node 3:**
* **Left (Node 5):** Green box. Contains: `0`, `1.00 0.00`, `12%`. Predicts class 0 with 100% probability, covering 12% of the data.
* **Right (Node 7):** Blue box. Contains: `1`, `.09 .91`, `56%`. Predicts class 1 with 91% probability, covering 56% of the data.
### Key Observations
1. **Variable Consistency:** Variable `77` is the most important in the GBM model (top-left) and is also a highlighted point in the information plot (top-right). Variable `X1627` is the most informative point (top-right) and is the root split in the decision tree (bottom-right) and an axis in the rank plot (bottom-left). Variable `X2327` is the second split in the tree and the other axis in the rank plot.
2. **Decision Boundary Correlation:** The decision tree's split values (`X1627 < 0.33`, `X2327 < 0.24`) correspond exactly to the vertical and horizontal lines drawn in the normalized rank scatter plot (bottom-left). This visually confirms the tree's logic.
3. **Class Separation:** The normalized rank plot shows that the two classes (circles vs. triangles) are largely separable using the two variables X1627 and X2327. The red triangles (likely the positive class, e.g., cancer) are characterized by high normalized ranks of both variables.
4. **Information Hierarchy:** The "Prostate Cancer Data" plot (top-right) suggests that a small number of variables (like X1627, X2327) carry disproportionately high "Total" and "Net" information compared to the majority of variables clustered near zero.
### Interpretation
This composite image tells a coherent story of a predictive modeling workflow for prostate cancer data:
1. **Feature Screening:** The analysis begins by identifying which variables in the dataset are most informative. The GBM importance plot and the "Total/Net Information" plot both highlight a small subset of key variables (`77`, `X1627`, `X2327`, etc.) from a larger pool.
2. **Model Building:** A decision tree model is built using the most critical features. The tree's structure is simple and interpretable, using only two primary splits on `X1627` and `X2327` to achieve a classification.
3. **Model Validation & Interpretation:** The normalized rank scatter plot serves as a visual validation of the tree model. It demonstrates that the chosen split points effectively separate the two classes in the feature space defined by the top two predictors. The quadrant with high ranks for both variables is strongly associated with one class (red triangles).
4. **Underlying Data Structure:** The plots suggest the dataset has a clear structure where class membership is strongly tied to the values of a few key biomarkers or features. The majority of other measured variables contribute little unique information for this classification task.
**In summary, the image documents a successful feature selection and modeling process, resulting in a simple, interpretable decision tree that leverages the most informative variables to separate prostate cancer cases from controls.**
DECODING INTELLIGENCE...