## Chart: Interaural Time Difference (ITD) vs. Angle
### Overview
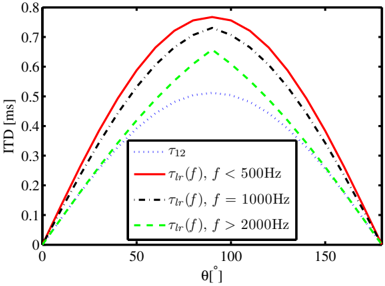
The image is a 2D plot showing the relationship between the Interaural Time Difference (ITD) in milliseconds (ms) and the angle θ in degrees. There are four data series plotted, each representing a different condition or model. The plot shows how ITD varies with angle for different frequency ranges and a reference model.
### Components/Axes
* **X-axis:** Angle θ, labeled "θ [°]". The scale ranges from 0 to 180 degrees, with tick marks at 0, 50, 100, and 150 degrees.
* **Y-axis:** Interaural Time Difference (ITD), labeled "ITD [ms]". The scale ranges from 0 to 0.8 ms, with tick marks at 0, 0.1, 0.2, 0.3, 0.4, 0.5, 0.6, 0.7, and 0.8 ms.
* **Legend:** Located in the center-right of the plot, enclosed in a box. The legend identifies the four data series:
* τ₁₂ (dotted blue line)
* τlr(f), f < 500Hz (solid red line)
* τlr(f), f = 1000Hz (dashed black line)
* τlr(f), f > 2000Hz (dashed green line)
### Detailed Analysis
* **τ₁₂ (dotted blue line):** This line represents a reference model. It starts at 0 ms at 0 degrees, increases to a peak of approximately 0.5 ms around 90 degrees, and then decreases back to 0 ms at 180 degrees.
* **τlr(f), f < 500Hz (solid red line):** This line represents the ITD for frequencies less than 500 Hz. It starts at 0 ms at 0 degrees, increases to a peak of approximately 0.77 ms around 90 degrees, and then decreases back to 0 ms at 180 degrees.
* **τlr(f), f = 1000Hz (dashed black line):** This line represents the ITD for a frequency of 1000 Hz. It starts at 0 ms at 0 degrees, increases to a peak of approximately 0.72 ms around 90 degrees, and then decreases back to 0 ms at 180 degrees.
* **τlr(f), f > 2000Hz (dashed green line):** This line represents the ITD for frequencies greater than 2000 Hz. It starts at 0 ms at 0 degrees, increases to a peak of approximately 0.65 ms around 90 degrees, and then decreases back to 0 ms at 180 degrees.
All lines start at (0,0) and end at (180,0).
### Key Observations
* All four data series exhibit a symmetrical, bell-shaped curve, peaking around 90 degrees.
* The ITD values are highest for lower frequencies (f < 500Hz) and decrease as the frequency increases.
* The reference model (τ₁₂) has the lowest ITD values compared to the other three series.
### Interpretation
The plot illustrates how the Interaural Time Difference (ITD) varies with the angle of sound incidence for different frequency ranges. The ITD is a crucial cue for sound localization, particularly at lower frequencies. The data suggests that:
* Lower frequencies (below 500 Hz) result in larger ITDs, which could contribute to more accurate sound localization at these frequencies.
* As frequency increases, the ITD decreases, potentially making sound localization less precise at higher frequencies based on ITD alone. Other cues, such as Interaural Level Difference (ILD), become more important at higher frequencies.
* The reference model (τ₁₂) consistently underestimates the ITD compared to the other models, suggesting it may not accurately capture the ITD across all frequency ranges.