\n
## Chart: Interaural Time Difference (ITD) vs. Angle
### Overview
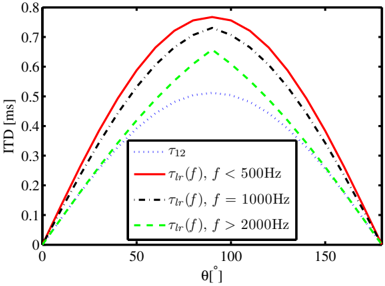
The image presents a chart illustrating the relationship between Interaural Time Difference (ITD) in milliseconds (ms) and angle θ̂ in degrees. Three curves are plotted, each representing a different frequency (f) range. The chart aims to demonstrate how ITD changes with angle for varying frequencies.
### Components/Axes
* **X-axis:** θ̂ [degrees]. Scale ranges from 0 to 180, with tick marks at 0, 50, 100, 150.
* **Y-axis:** ITD [ms]. Scale ranges from 0 to 0.8, with tick marks at 0, 0.2, 0.4, 0.6, 0.8.
* **Legend:** Located in the top-right corner. Contains the following entries:
* τ₁₂ (dotted line, grey)
* τIr(f), f < 500Hz (solid red line)
* τIr(f), f = 1000Hz (dashed black line)
* τIr(f), f > 2000Hz (dashed green line)
### Detailed Analysis
* **τIr(f), f < 500Hz (Red Line):** This curve exhibits a symmetrical, bell-shaped trend. It starts at approximately 0 ms at θ̂ = 0 degrees, rises to a peak of approximately 0.74 ms at θ̂ = 100 degrees, and then descends back to approximately 0 ms at θ̂ = 180 degrees.
* **τIr(f), f = 1000Hz (Black Dashed Line):** This curve also shows a symmetrical, bell-shaped trend, but with a higher peak and a narrower width compared to the red line. It starts at approximately 0 ms at θ̂ = 0 degrees, reaches a peak of approximately 0.78 ms at θ̂ = 100 degrees, and returns to approximately 0 ms at θ̂ = 180 degrees.
* **τIr(f), f > 2000Hz (Green Dashed Line):** This curve displays a similar symmetrical, bell-shaped trend, but with the lowest peak and narrowest width. It begins at approximately 0 ms at θ̂ = 0 degrees, peaks at approximately 0.65 ms at θ̂ = 100 degrees, and descends to approximately 0 ms at θ̂ = 180 degrees.
* **τ₁₂ (Grey Dotted Line):** This curve is a low amplitude, symmetrical curve. It starts at approximately 0.25 ms at θ̂ = 0 degrees, rises to a peak of approximately 0.32 ms at θ̂ = 100 degrees, and then descends back to approximately 0.25 ms at θ̂ = 180 degrees.
### Key Observations
* The ITD increases with angle up to a certain point (around 100 degrees) and then decreases.
* The peak ITD value decreases as the frequency increases. This suggests that higher frequencies have a smaller interaural time difference for a given angle.
* The width of the curves decreases as the frequency increases, indicating that the ITD is more sensitive to angle changes at higher frequencies.
* The τ₁₂ curve is consistently lower in magnitude than the other curves.
### Interpretation
The chart demonstrates the frequency-dependent nature of the Interaural Time Difference (ITD). ITD is a crucial cue for sound localization, particularly for low-frequency sounds. The data suggests that as frequency increases, the ITD becomes smaller and more sensitive to changes in angle. This is because higher frequencies have shorter wavelengths and are more easily diffracted around the head, reducing the time difference between when the sound reaches each ear. The τ₁₂ curve likely represents a baseline or reference value, potentially related to the head size or a constant delay. The relationship between ITD and frequency is fundamental to understanding how humans and other animals perceive the direction of sound. The curves are symmetrical, indicating that the ITD is independent of the direction of the sound source (left or right).