## Line Graph: Interaural Time Difference (ITD) vs. Angle (θ)
### Overview
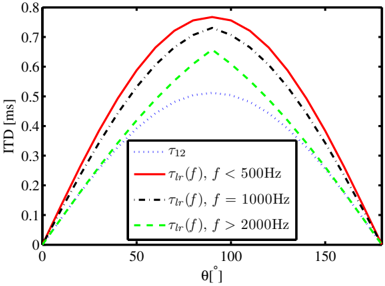
The graph depicts the relationship between Interaural Time Difference (ITD) in milliseconds (y-axis) and angle (θ) in degrees (x-axis). Four distinct lines represent different frequency-dependent ITD responses, with the legend clarifying their associations. The x-axis spans 0° to 180°, and the y-axis ranges from 0 to 0.8 ms.
### Components/Axes
- **X-axis (θ[°])**: Angle, labeled in degrees, spanning 0° to 180°.
- **Y-axis (ITD [ms])**: Interaural Time Difference, labeled in milliseconds, ranging from 0 to 0.8 ms.
- **Legend**: Located in the bottom-left corner, associating line styles/colors with frequency-dependent ITD parameters:
- **Dotted purple**: τ₁₂ (no frequency condition).
- **Solid red**: τₗᵣ(f), f < 500 Hz.
- **Dashed black**: τₗᵣ(f), f = 1000 Hz.
- **Dash-dot green**: τₗᵣ(f), f > 2000 Hz.
### Detailed Analysis
1. **Solid Red Line (τₗᵣ(f), f < 500 Hz)**:
- Peaks at ~100° with ITD ≈ 0.75 ms.
- Symmetrical curve, rising to the peak and declining equally on both sides.
- Matches the highest ITD values across the θ range.
2. **Dashed Black Line (τₗᵣ(f), f = 1000 Hz)**:
- Peaks at ~100° with ITD ≈ 0.7 ms.
- Slightly lower amplitude than the red line, maintaining symmetry.
3. **Dash-Dot Green Line (τₗᵣ(f), f > 2000 Hz)**:
- Peaks at ~100° with ITD ≈ 0.65 ms.
- Lower amplitude than the black line, consistent symmetry.
4. **Dotted Purple Line (τ₁₂)**:
- Peaks at ~100° with ITD ≈ 0.5 ms.
- Lowest amplitude among all lines, forming a baseline.
All lines start and end at 0 ms at 0° and 180°, forming symmetrical parabolic curves centered at 100°.
### Key Observations
- **Frequency-Dependent ITD**: Higher frequencies (f > 2000 Hz) exhibit lower peak ITD values compared to lower frequencies (f < 500 Hz).
- **Symmetry**: All curves are symmetric about 100°, suggesting a consistent relationship between θ and ITD.
- **τ₁₂ Baseline**: The dotted purple line (τ₁₂) consistently underlies other lines, indicating a reference or constant parameter.
### Interpretation
The graph demonstrates that ITD varies with both angle (θ) and sound frequency. Lower frequencies (<500 Hz) produce the largest ITD peaks (~0.75 ms), while higher frequencies (>2000 Hz) show reduced ITD (~0.65 ms). The τ₁₂ parameter (dotted purple) acts as a baseline, possibly representing a non-frequency-specific ITD component. This suggests that auditory localization mechanisms may prioritize lower-frequency sounds for precise angular discrimination, as their ITD responses are more pronounced. The symmetry of all curves implies a linear relationship between θ and ITD within the measured range, with deviations likely influenced by physiological or environmental factors not explicitly modeled here.