## Line Chart: Accuracy vs. Attack Ratio for Federated Learning Defenses
### Overview
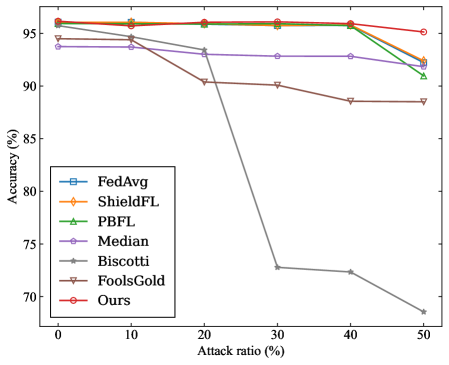
This line chart compares the accuracy of several Federated Learning (FL) defense mechanisms under varying attack ratios. The x-axis represents the attack ratio (percentage), and the y-axis represents the accuracy (percentage). Six different defense strategies are plotted as lines, showing how their performance degrades as the attack ratio increases.
### Components/Axes
* **X-axis:** "Attack ratio (%)" - Scale ranges from 0% to 50%, with markers at 0, 10, 20, 30, 40, and 50.
* **Y-axis:** "Accuracy (%)" - Scale ranges from 70% to 96%, with markers at 70, 75, 80, 85, 90, 95.
* **Legend (bottom-left):** Lists the defense mechanisms and their corresponding line colors:
* FedAvg (blue)
* ShieldFL (orange)
* PBFL (green)
* Median (purple)
* Biscotti (grey)
* FoolsGold (brown)
* Ours (red)
### Detailed Analysis
Here's a breakdown of each line's trend and approximate data points, verified against the legend colors:
* **FedAvg (blue):** The line is relatively flat, starting at approximately 94% accuracy at 0% attack ratio and decreasing slightly to around 92% at 50% attack ratio.
* **ShieldFL (orange):** Starts at approximately 95% accuracy at 0% attack ratio. It remains relatively stable until around 30% attack ratio, then declines more rapidly, reaching approximately 90% at 50% attack ratio.
* **PBFL (green):** Starts at approximately 95% accuracy at 0% attack ratio. It remains stable until approximately 40% attack ratio, then declines to around 91% at 50% attack ratio.
* **Median (purple):** Starts at approximately 94% accuracy at 0% attack ratio. It remains relatively flat, decreasing slightly to around 92% at 50% attack ratio.
* **Biscotti (grey):** Starts at approximately 94% accuracy at 0% attack ratio. It declines steadily, reaching approximately 89% at 50% attack ratio.
* **FoolsGold (brown):** Starts at approximately 95% accuracy at 0% attack ratio. It remains stable until approximately 20% attack ratio, then declines sharply, reaching approximately 72% at 50% attack ratio.
* **Ours (red):** Starts at approximately 95% accuracy at 0% attack ratio. It remains stable until approximately 30% attack ratio, then declines rapidly, reaching approximately 68% at 50% attack ratio.
### Key Observations
* **FoolsGold and Ours** exhibit the most significant performance degradation as the attack ratio increases.
* **FedAvg, ShieldFL, PBFL, and Median** demonstrate relatively robust performance, maintaining accuracy above 90% even at a 50% attack ratio.
* **Biscotti** shows a moderate decline in accuracy with increasing attack ratio.
* The most substantial drops in accuracy occur between 20% and 50% attack ratio for several methods.
### Interpretation
The chart demonstrates the varying resilience of different Federated Learning defense mechanisms against adversarial attacks. The "attack ratio" likely represents the proportion of malicious participants in the federated learning process. The data suggests that some defenses (FedAvg, ShieldFL, PBFL, Median) are more effective at mitigating the impact of attacks than others (FoolsGold, Ours). The rapid decline in accuracy for FoolsGold and Ours indicates they are particularly vulnerable to attacks, potentially due to their underlying mechanisms being easily circumvented by malicious actors. The relatively stable performance of FedAvg, ShieldFL, PBFL, and Median suggests they incorporate more robust defenses against adversarial manipulation. The chart highlights the importance of selecting appropriate defense strategies based on the expected level of adversarial activity in a federated learning environment. The fact that all methods degrade with increasing attack ratio suggests that no defense is perfect, and a combination of strategies might be necessary for optimal security.