## Scatter Plot: Audio Model Performance vs. Parameter Count
### Overview
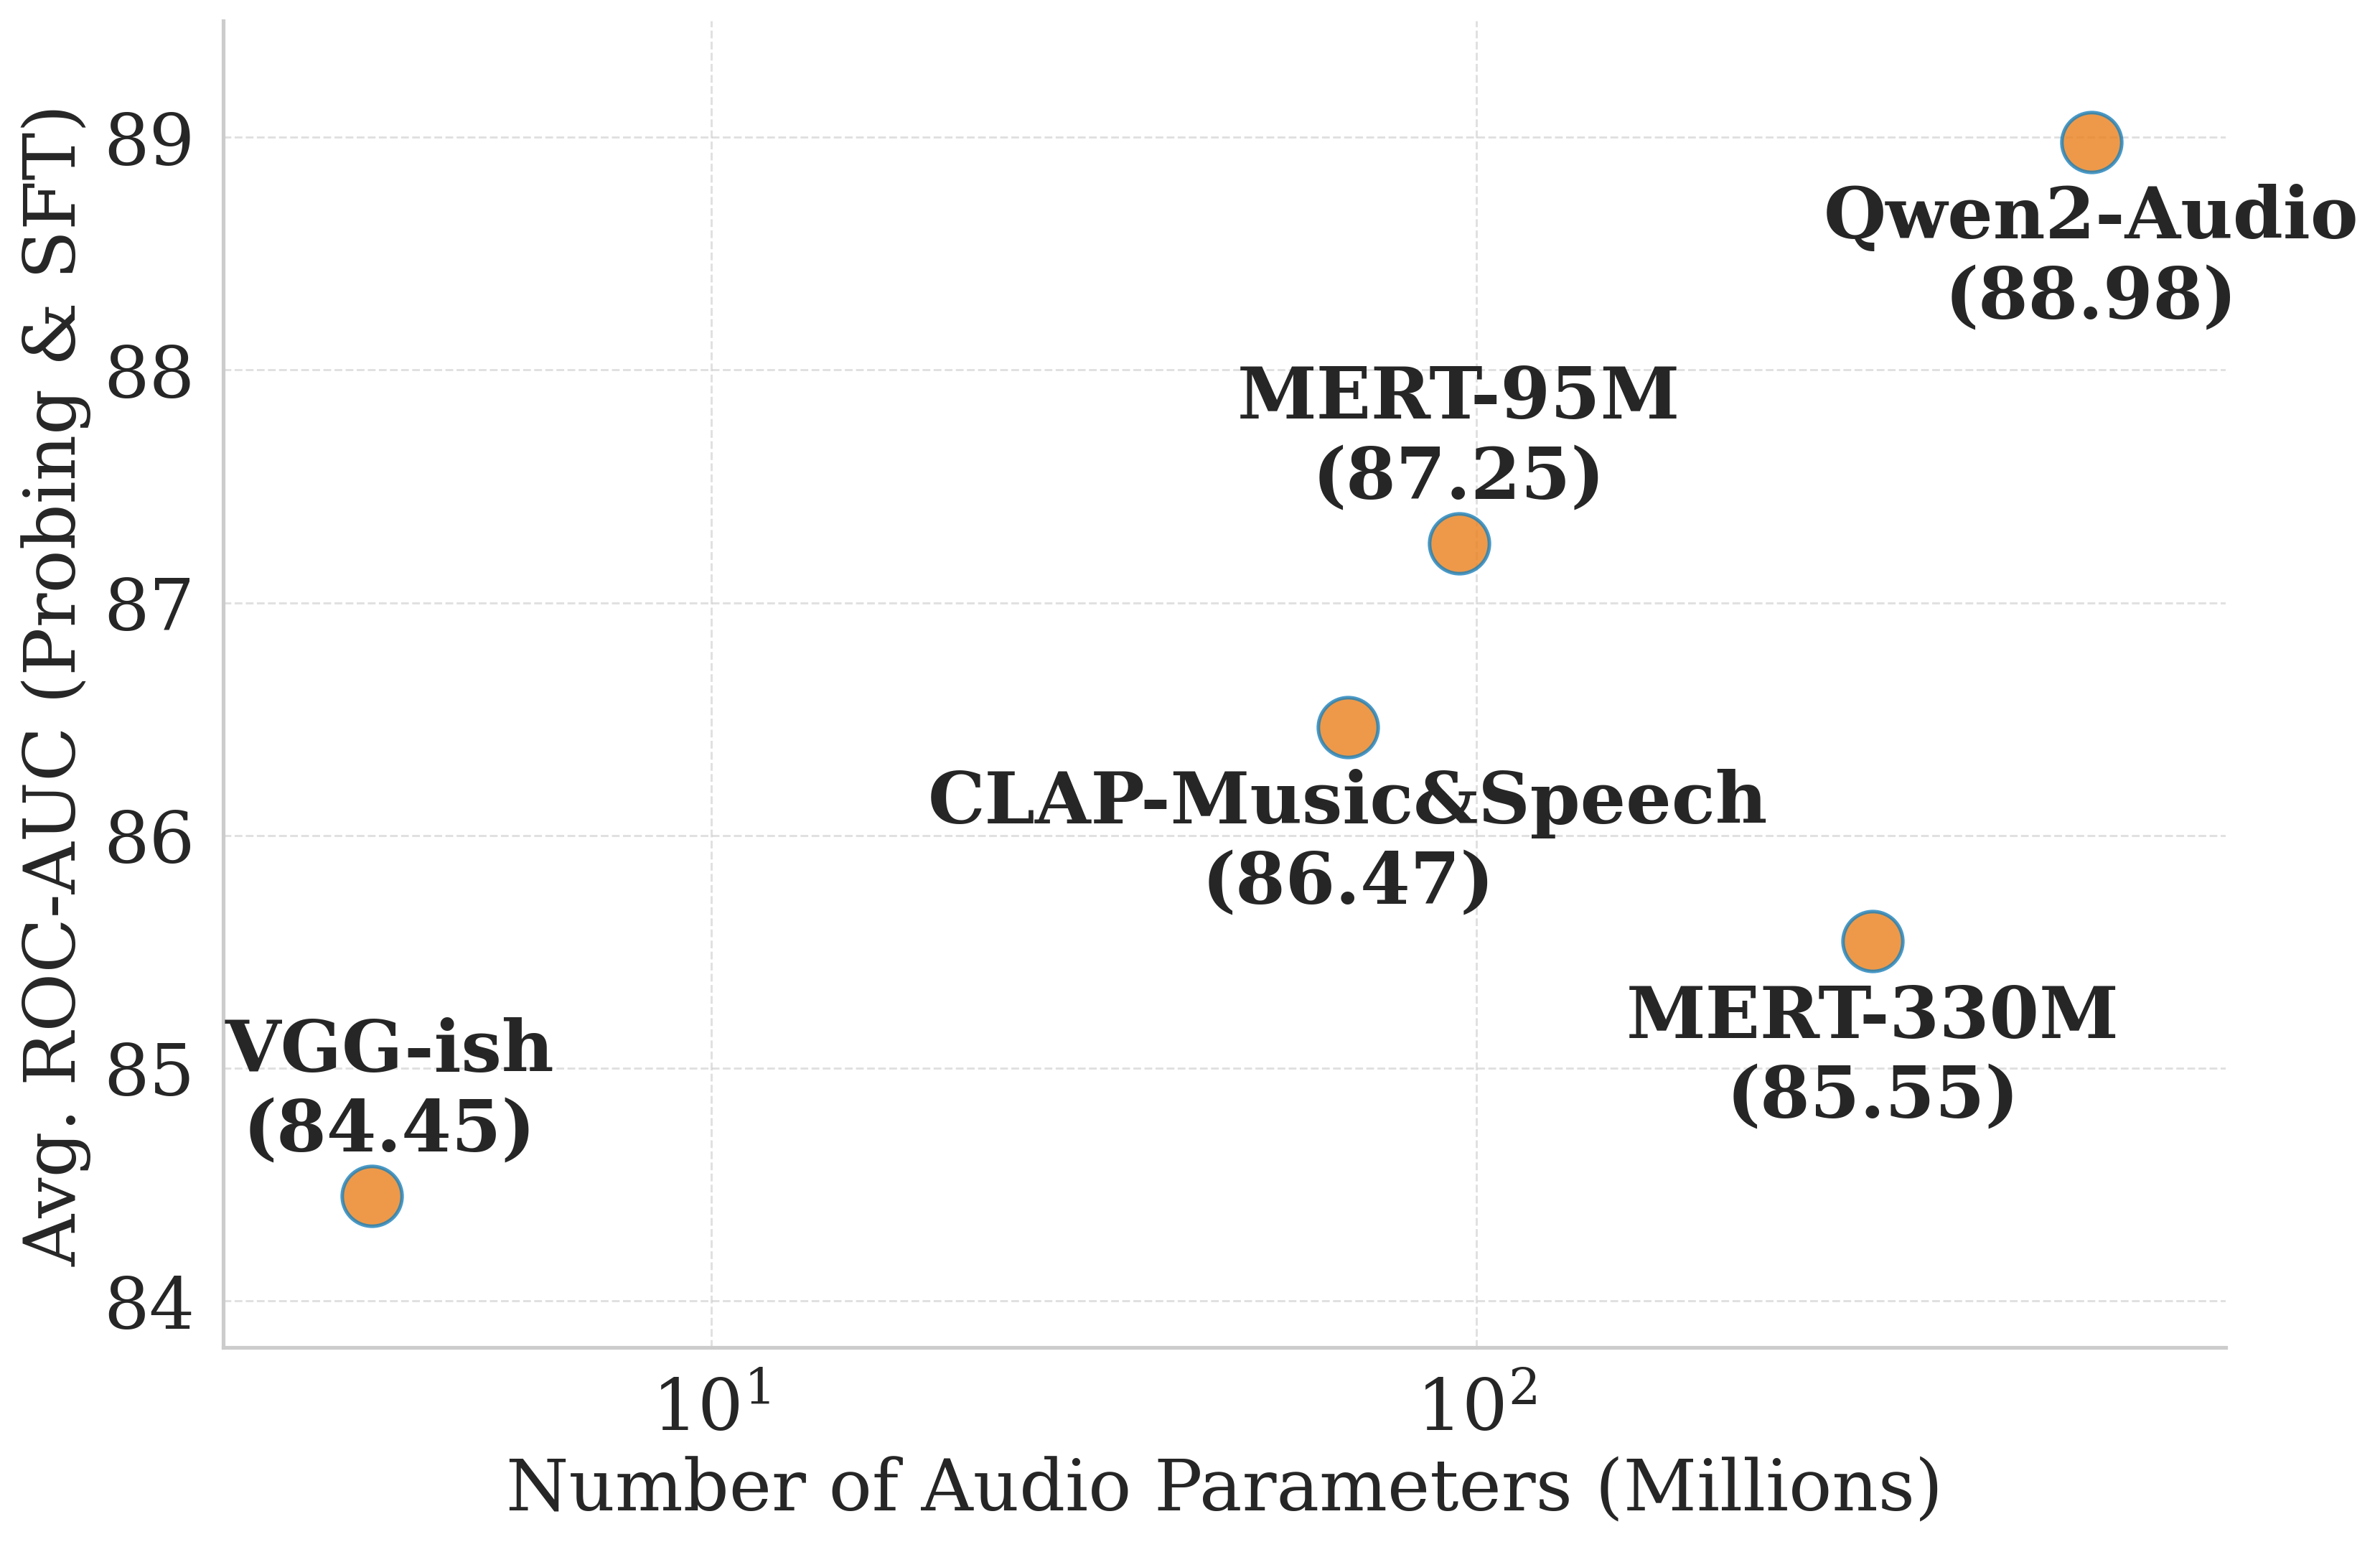
This image is a scatter plot visualizing the relationship between the size of various audio models (measured in millions of parameters) and their performance (measured by Average ROC-AUC for Probing & SFT). The chart displays five distinct models, illustrating that while there is a general trend toward higher performance with larger models, it is not a strictly linear relationship.
### Components/Axes
* **Y-Axis (Vertical):** Labeled "Avg. ROC-AUC (Probing & SFT)". The scale ranges from 84 to 89, with grid lines at every integer unit.
* **X-Axis (Horizontal):** Labeled "Number of Audio Parameters (Millions)". The scale is logarithmic, with major markers at $10^1$ (10 million) and $10^2$ (100 million).
* **Data Points:** Represented by orange circles with blue outlines. Each point is annotated with the model name and its specific numerical performance value.
### Detailed Analysis
The data points are distributed across the chart as follows:
1. **VGG-ish (84.45)**
* **Position:** Bottom-left.
* **X-axis:** Located to the left of the $10^1$ marker (indicating < 10 million parameters).
* **Y-axis:** Lowest performance value on the chart.
2. **CLAP-Music&Speech (86.47)**
* **Position:** Center-left.
* **X-axis:** Located between $10^1$ and $10^2$ (closer to $10^2$).
* **Y-axis:** Mid-range performance.
3. **MERT-95M (87.25)**
* **Position:** Top-center.
* **X-axis:** Located just to the left of the $10^2$ marker (indicating approximately 95 million parameters).
* **Y-axis:** High performance, second only to Qwen2-Audio.
4. **MERT-330M (85.55)**
* **Position:** Bottom-right.
* **X-axis:** Located to the right of the $10^2$ marker (indicating approximately 330 million parameters).
* **Y-axis:** Lower performance than the smaller MERT-95M model.
5. **Qwen2-Audio (88.98)**
* **Position:** Top-right.
* **X-axis:** Located to the right of the $10^2$ marker (indicating the highest parameter count of the group).
* **Y-axis:** Highest performance value on the chart.
### Key Observations
* **Non-Linear Scaling:** There is no direct correlation between parameter count and performance. The most notable anomaly is the comparison between the two MERT models: MERT-330M has significantly more parameters than MERT-95M but achieves a lower ROC-AUC score (85.55 vs 87.25).
* **Performance Ceiling:** Qwen2-Audio represents the current peak in both size and performance among the plotted models.
* **Clustering:** The models are spread out, suggesting a diverse range of architectures or training methodologies rather than a single scaling law being applied across all models.
### Interpretation
The data demonstrates that "bigger is not always better" in the context of these specific audio models. While Qwen2-Audio successfully leverages a higher parameter count to achieve the best performance, the MERT-330M model shows a performance regression compared to its smaller counterpart (MERT-95M). This suggests that architectural efficiency, data quality, and training techniques are likely more critical factors for performance than raw parameter count alone. The chart serves as a comparative benchmark to justify the efficacy of newer models like Qwen2-Audio against established baselines.